Experimental Design Sprints to Shape a New Product
SR. UX DESIGNER / WORKSHOP FACILITATOR
Objective
We were hired to empower a business unit that rotates through different research teams in an attempt to identify the next new product.
We were tasked to help them workshop concepts, wrangle a variety of stakeholders, prototype ideas, and come up with a strong MVP for a fundraising pitch.
My Role
I prepared and led the workshops, translated outcomes into concepts, wireframed them, and created most of the content for the presentation decks.
I had support from a jr. visual designer, and reported to a Creative Director who owned the client relationship and kept us on our toes.
Results
From workshops, to design sprints, we tested a variety of ideas, and ultimately designed an MVP that obtained funding and became a very profitable reality.
Impact
The product we co-created is now in use by a variety of enterprises, from agriculture to insurance, and helped unearth archeological features at the Nazca Lines in Perú.
Background
Background
From big-data to quantum mechanics
IBM Research is the largest industrial R&D organization in the world, out of which six nobel prizes have been attained.
They host teams of scientists and engineers working on a variety of projects with full autonomy. Some of these become comercially viable products:
- Deep Blue and Watson
- The first Quantum Computer
- Excimer Laser (Lasik)
- Fractal Geometry (Mandelbrot)
- Graphene, the nanomaterial
Running workshops with these guys would be a game of constantly "switching altitude", from very abstract concepts, to novel tactical solutions.

Our Project
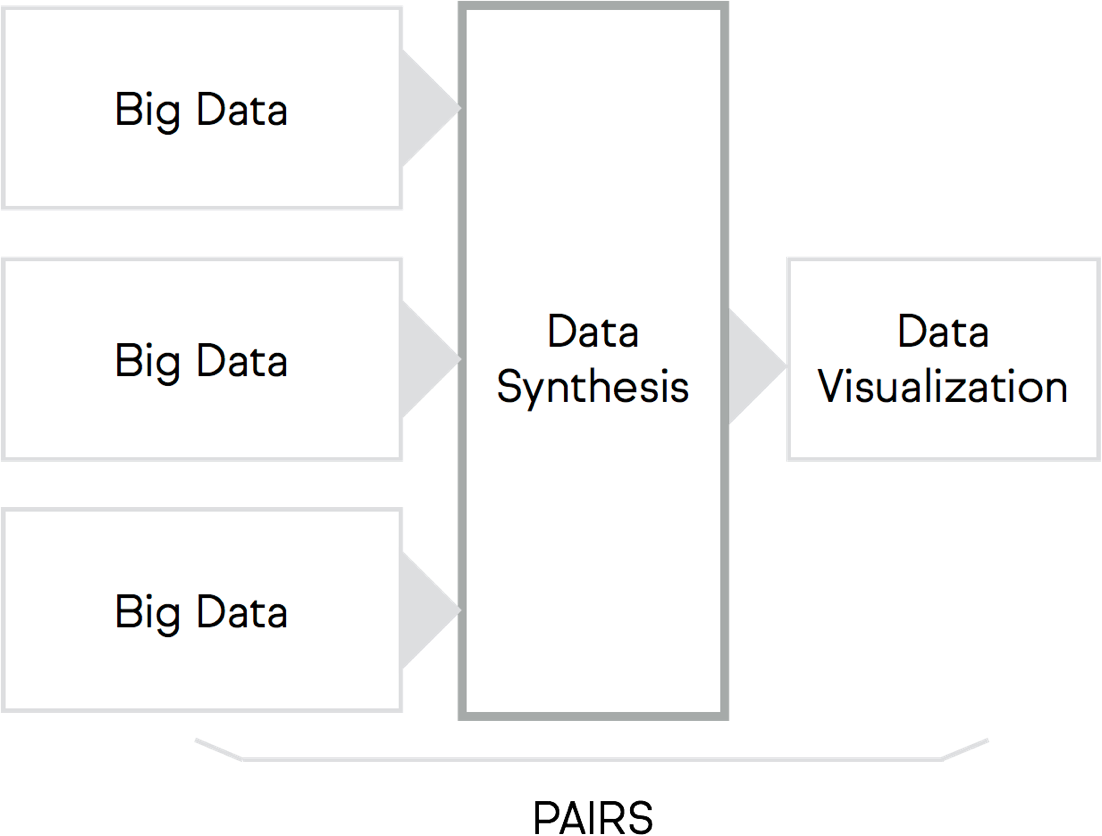
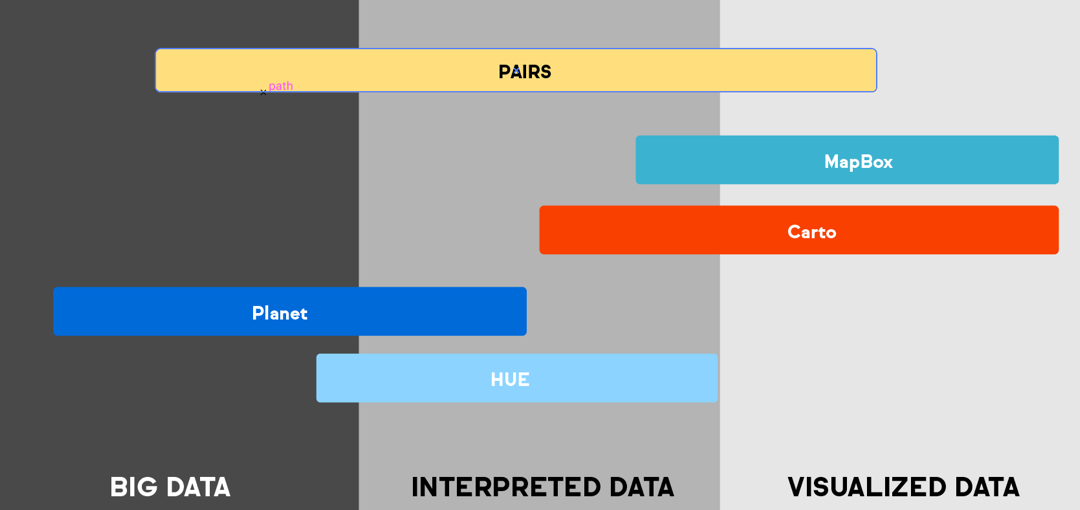
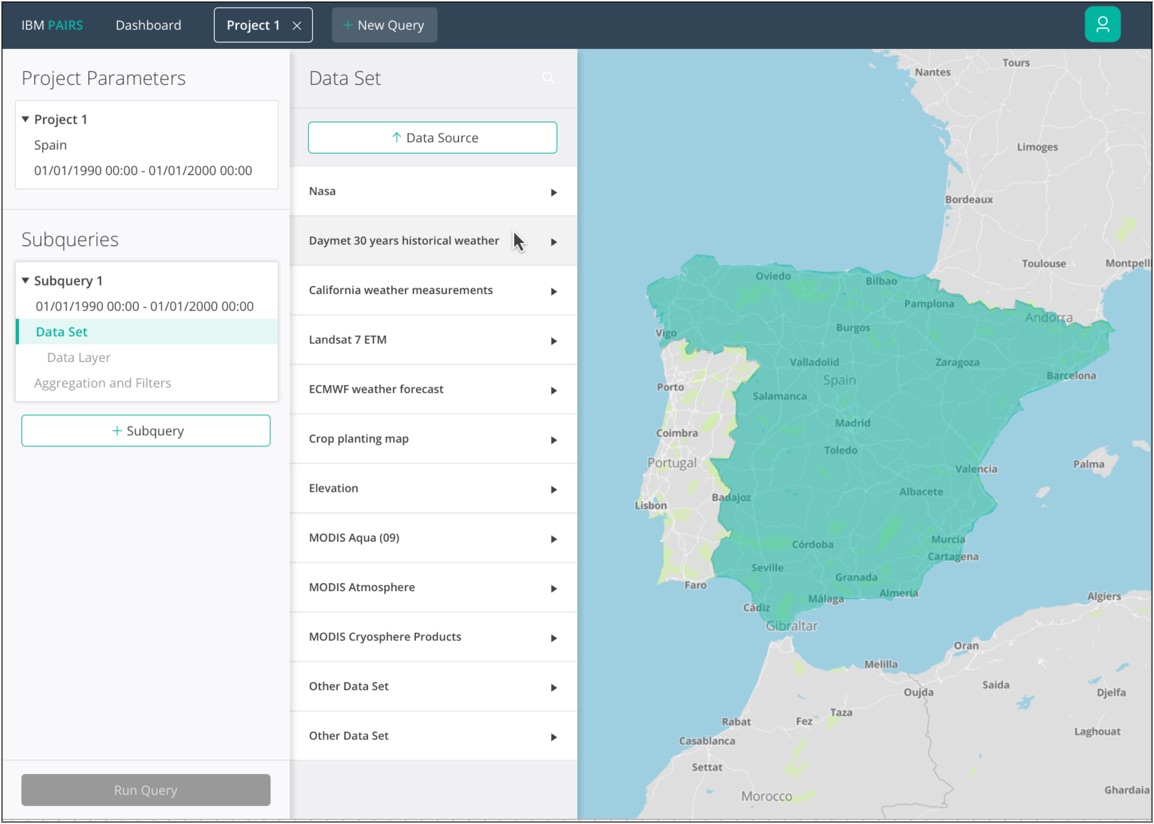
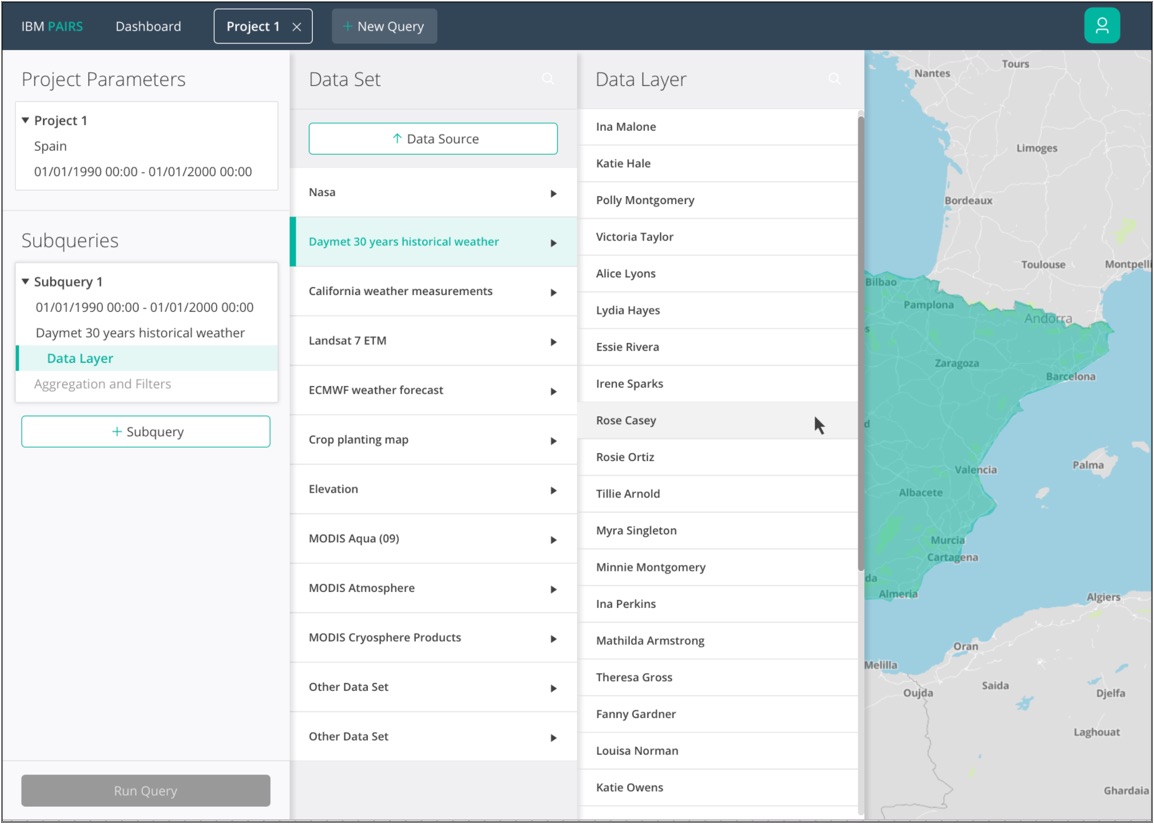
Acting as parters with the emerging technologies team, we were called to facilitate incubation and acceleration processes for several internal programs. We would start out with a Big-Data platform called PAIRS (Physical Analytics Integrated Data Repository and Services).
IBM PAIRS is a Geospatial big-data analysis environment. It’s capable of querying a large array of massive global databases.
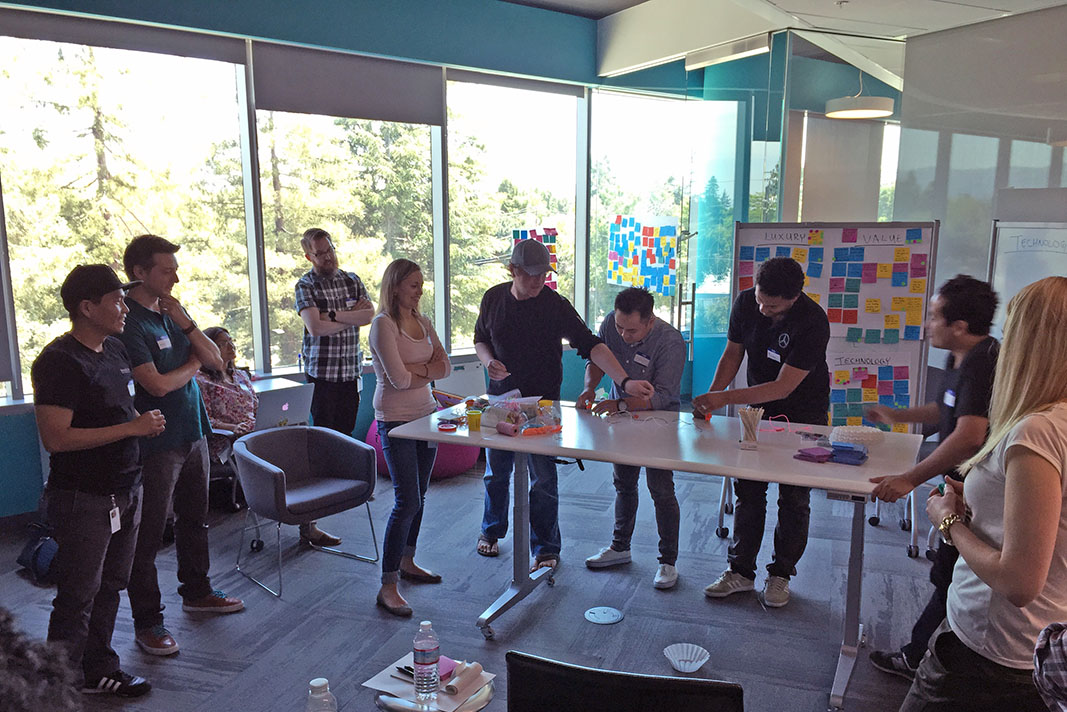
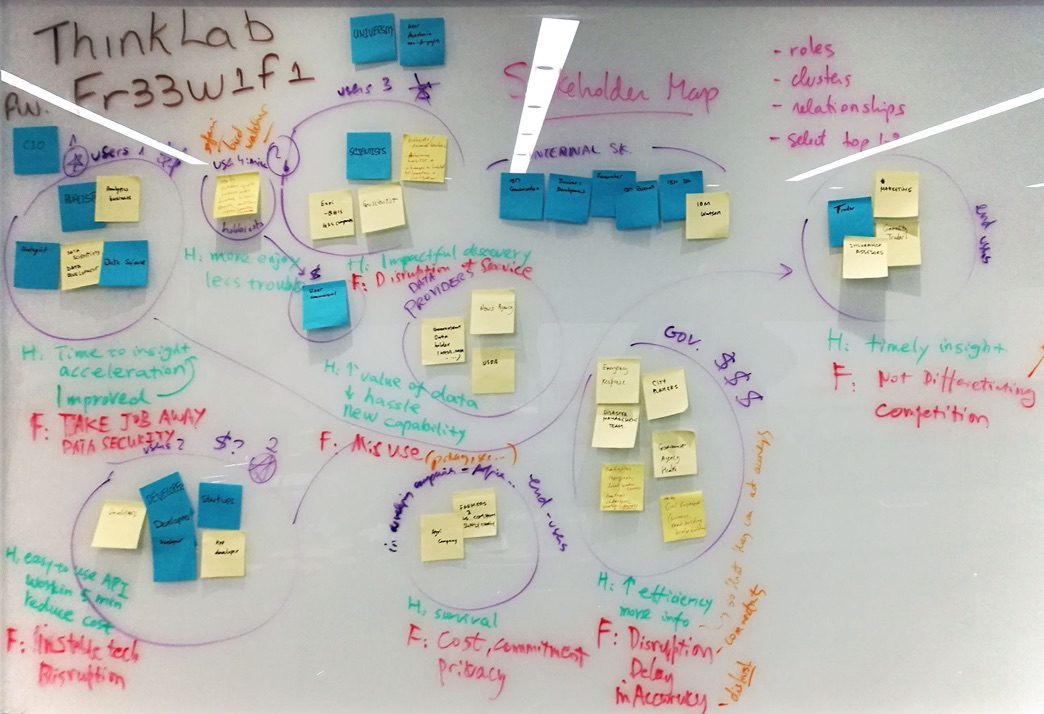
I kickstarted the program facilitating a two-day product discussion workshop, gathering all of the immediate stakeholders in one room (many of whom had never met) and through different exercises, participants expressed their hopes, fears and expectations for the product to be.
For the second day, we split into teams, and using a Business Model canvas, each team identified their key partners, activities, resources, value prop, and revenue stream, for their unique vision for PAIRS. Each team also selected three key stakeholders and defined their main personas.
Though the main objective of the workshop was internal alignment. We had variety of strong concepts to test through design Sprints:
- Historical geospatial data for Education
- Disaster tracking and prevention for NGO's
- Journalism and infographic generation for Newspapers
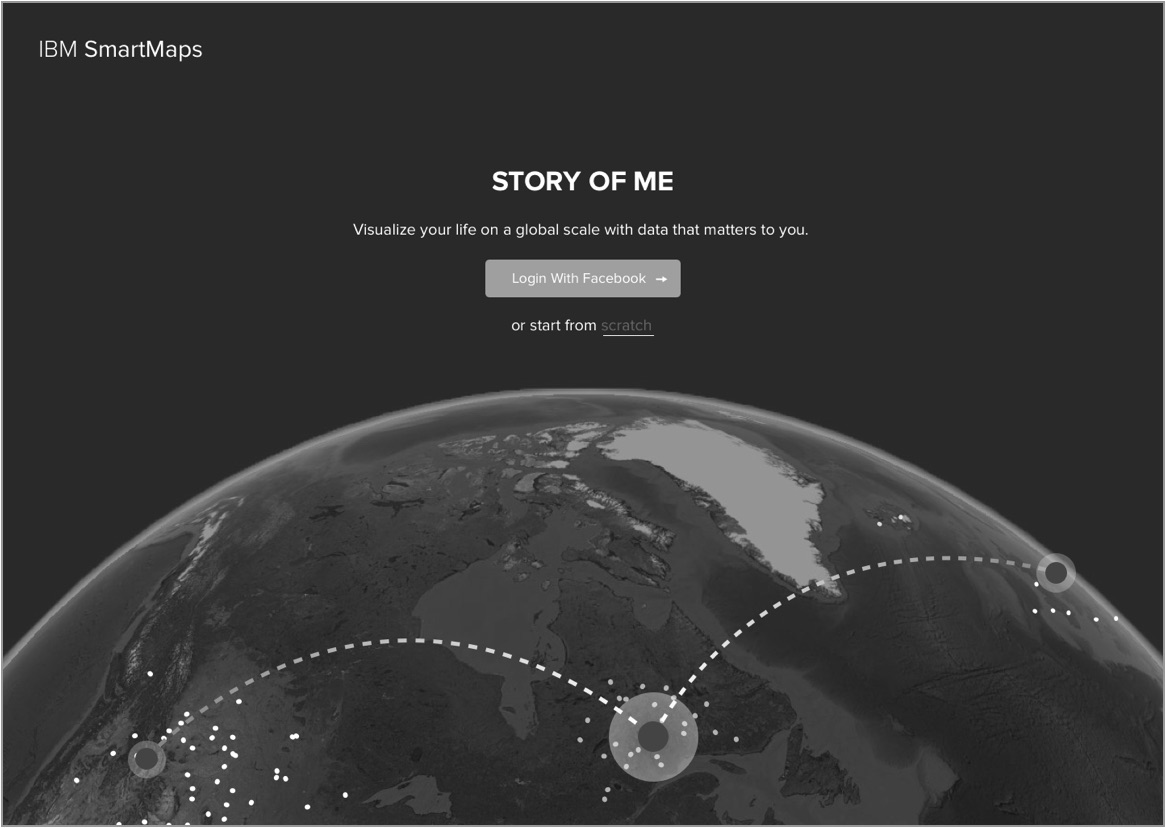
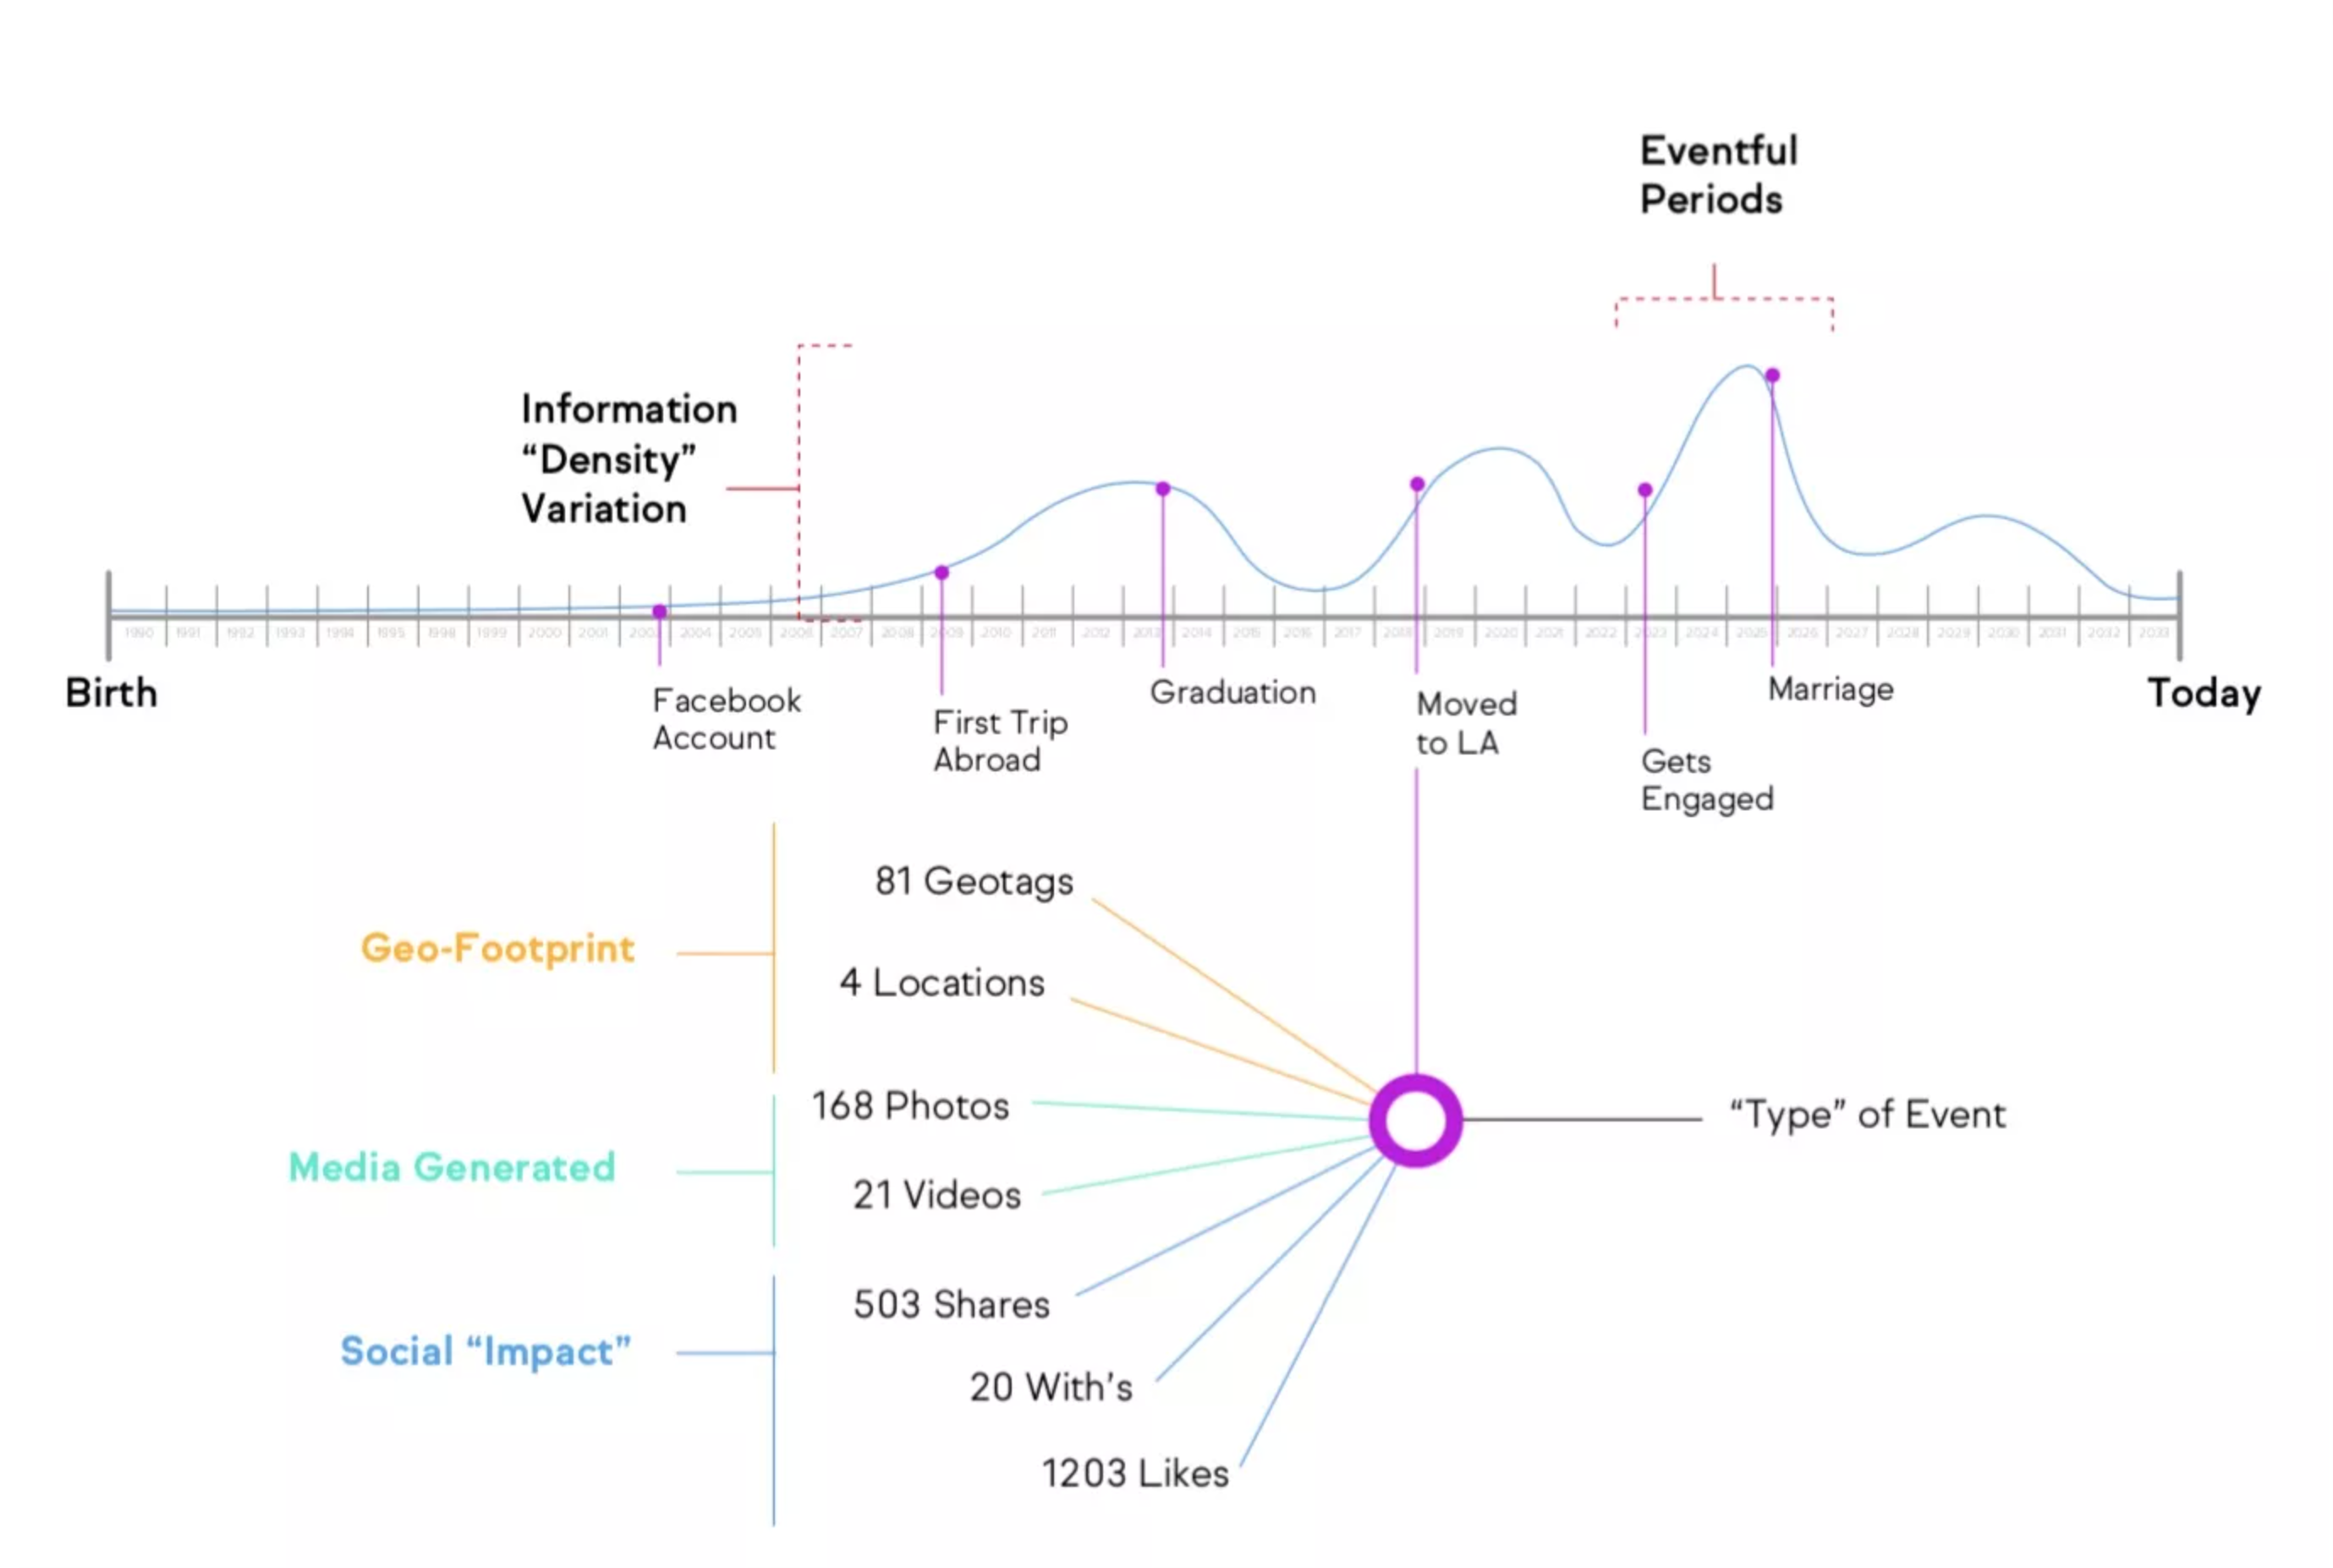
- "The story of myself" Quantified social media tracking
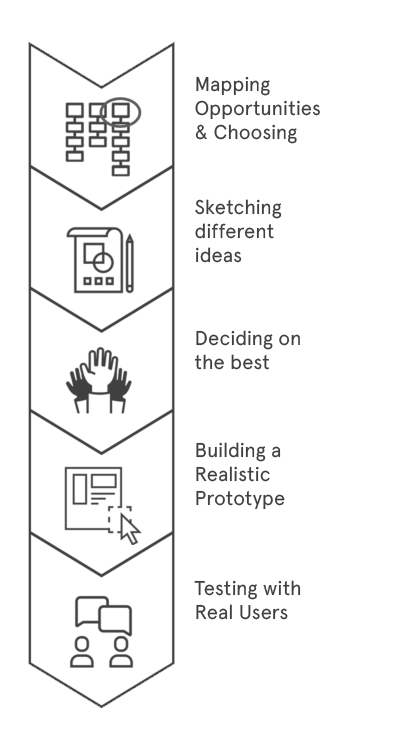
Design Sprints
Iteration to find clarity
We moved quickly to prototype some of the concepts presented during the workshop, and see where the different approaches were similar, where we would hone in, and where we would ‘prune’.
You might be tempted to think, what? prototyping now? what about business gap analysis? business charters? user research?... etc.
If you want to be fast, and make strong intentional decisions, you need to explore all these aspects simultaneously. Business, Design and Tech don't live in silos.
Business plans as a starting point give a false sense of comfort. If you're aiming for real world market fit, you need to get your hands dirty, and try and discard a variety of different ideas, which in turn might lead to new angles and insights you had not considered.
Trial and Error.
Some of the bigger conceptual challenges that we faced started to emerge during this process.
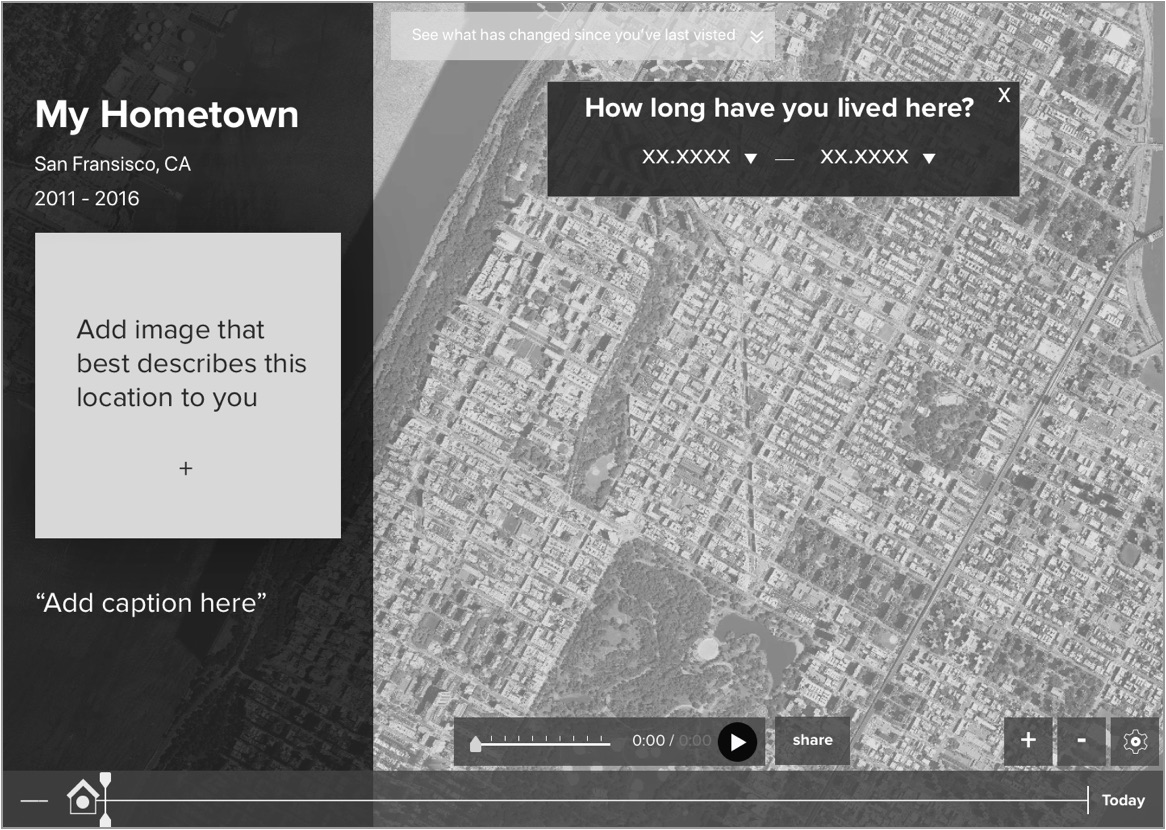
We were aiming at making the experience inutive and flexible.
We wanted the concepts to be self explanatory
Setting parameters to automatically organize visualizations based on the information type was a challenge that emerged throughout the different sprints.

Filtering and navigating different information density throughout an analog timeline was one of the first problems we explored.
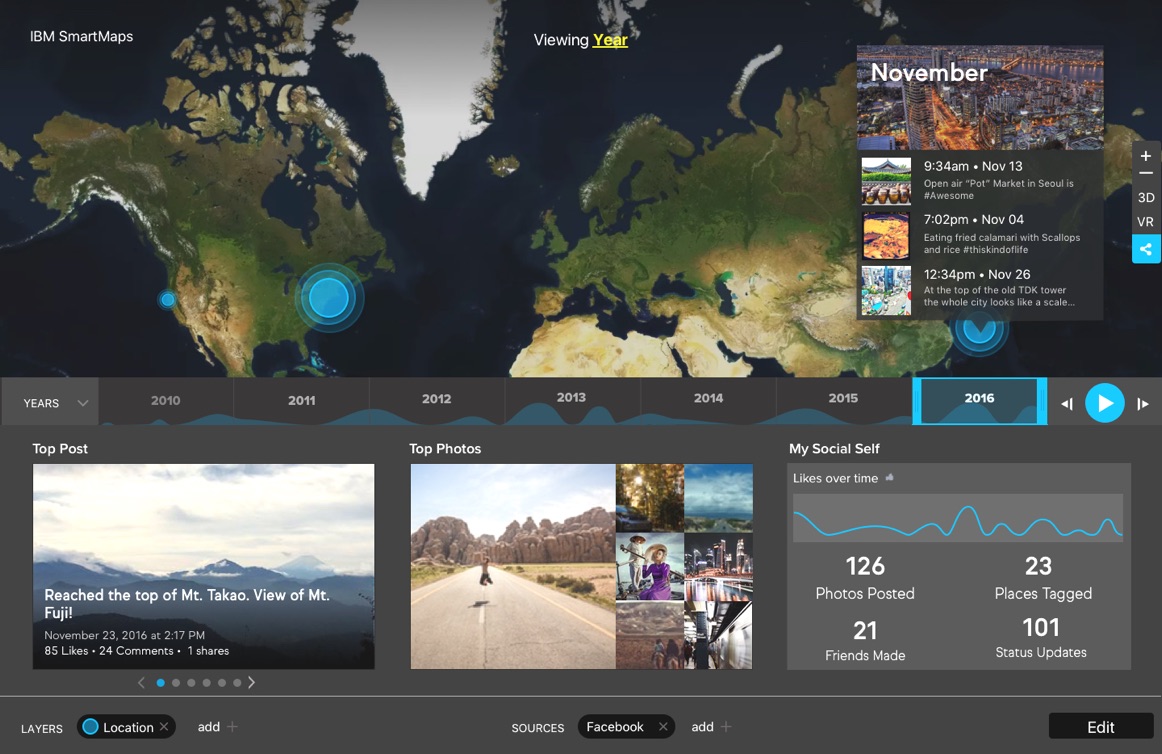
Visualization
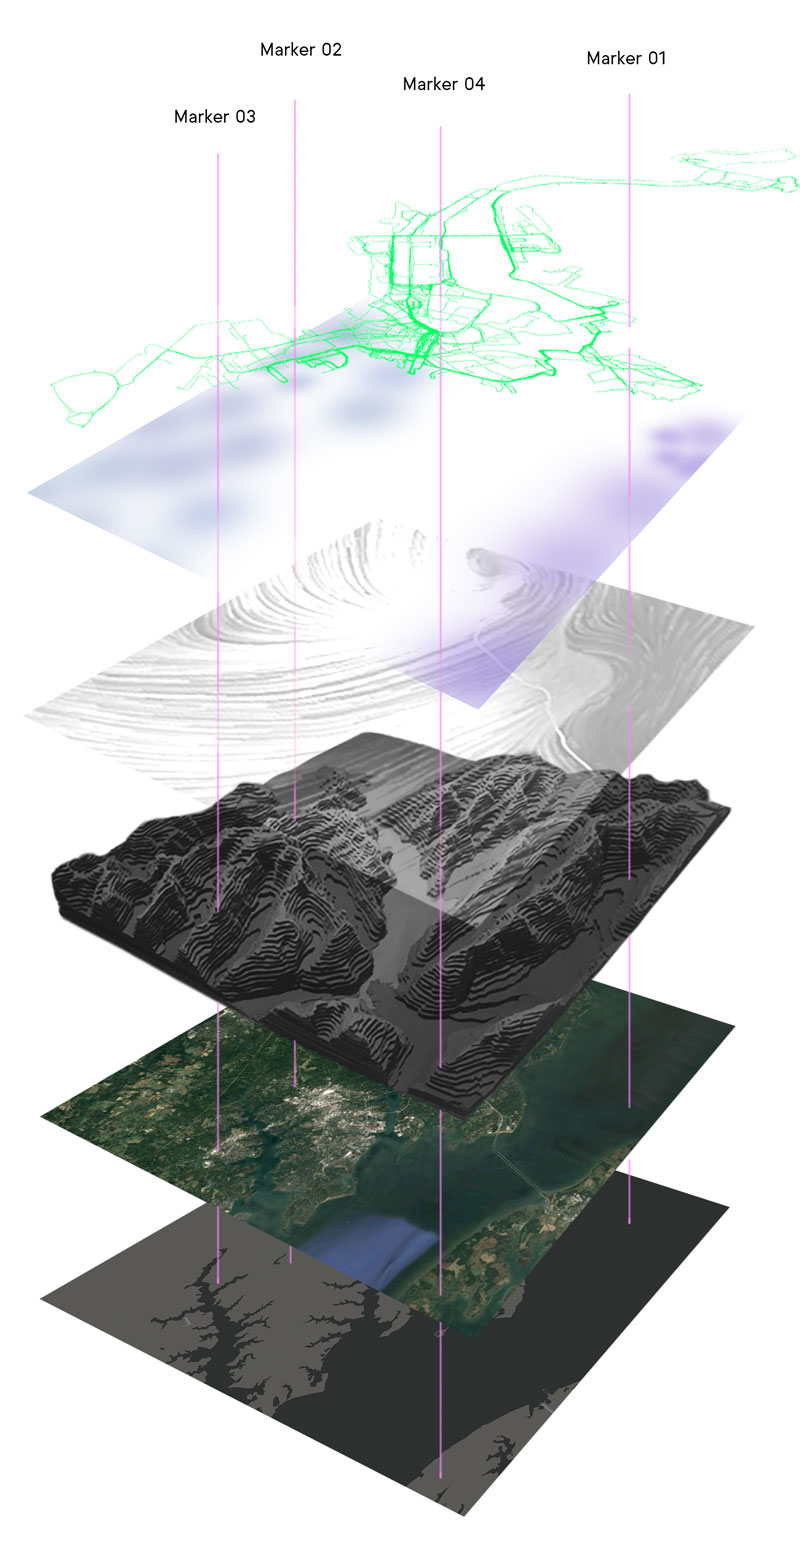
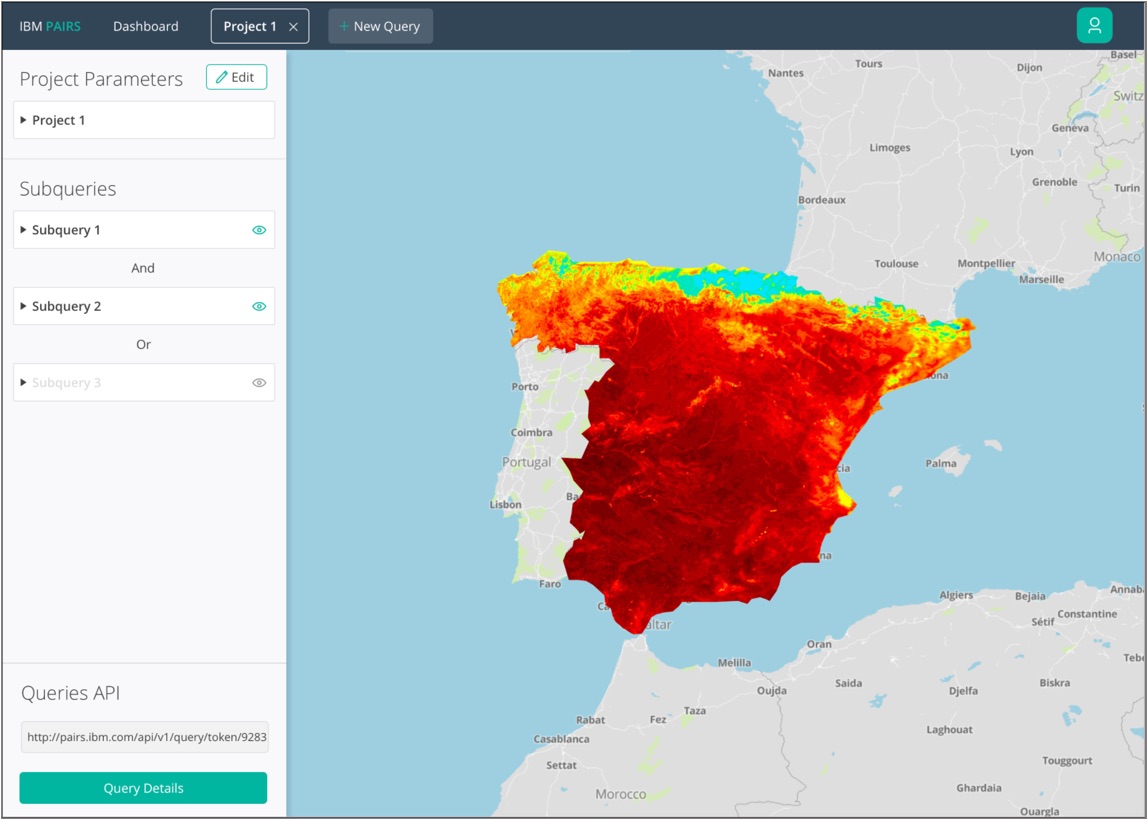
We realized, no matter what product direction we take, we'll need a system of overlapping layers, based on an information taxonomy.
For example, vector-type data would be rendered in a point, while area would be rendered in hues, photos and text would have their own section.
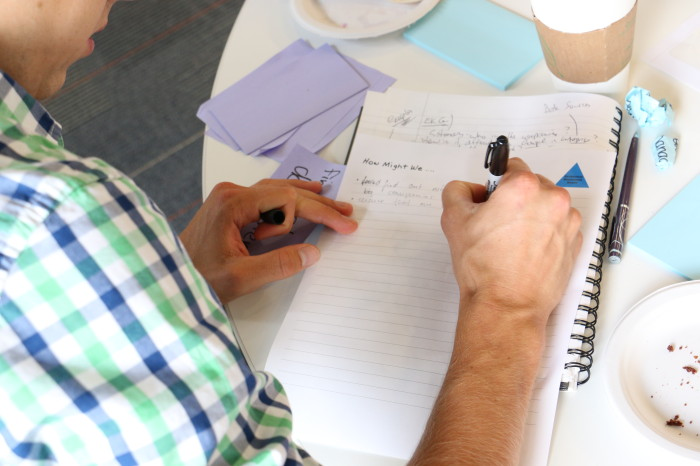
User Stories
As we repeatedly workshopped different ideas internally while progressing the protoypes, we considered it was crucial to write the story behind the personas that our stakeholders considered our future audiences. These would put into evidence how realistic (or unrealistic) the concept really was, and give us a framework to understand the motivation behind why they would (or wouldn't) use the product.
Definition achieved
Moving towards an MVP
After workshopping, prototyping, testing, and discussing rounds of feedback, we were able to strategically identify a niche functionality that could become the core strength of PAIRS, and we created an actionable roadmap that would shape this into a real MVP.
Value Proposition
Being able to visualize complex geospatial models, by operating through different layers or data.
Definition achieved
Moving towards an MVP
After workshopping, prototyping, testing, and discussing rounds of feedback, we were able to strategically identify a niche functionality that could become the core strength of PAIRS, and we created an actionable roadmap that would shape this into a real MVP.
Value Proposition
As of then, PAIRS was able to query huge databases across space and time.
This enabled a variety of use-cases, but none of the concepts by themselves seemed to get to a mature enough stage where we would see it gain traction.
But looking at the data layer visualization model, we realized that, if we could make PAIRS operate and synthetize different queries into one, we could come up with something really poweful, that no one else is doing.
Being able to visualize un-observable geographical models, by combining and operating through any kind of geo-data.
For example:
- Forestal Fire Risk (InsureTech) = Foliage Accumulation / Temperature (dryness and heat) / Population Density
- Structural Change Detection (Taxation) = Elevation Map 2017 / Elevation Map 2018
- Yields by crop (AgriTech) = Historical Rainfall / Soil moisture Retention / Potassium Concentration
We had a final round of prototyping and internal testing, and everyone got very excited about the direction we had achieved with this concept.
The business side of the team identified pre-existing client relationships that would be interested in this, and made some financial estimations.
I created a compelling deck for our IBM team, they pitched the concept (with potential client list, and pricing model) to IBM Bluemix, and got green lighted to develop the product, with a sizeable funding for an acutal Beta Launch.
My agency (and specifically my team) was hired to make the first round of deliverables for the Bluemix dev team.
The Product Design
I led a small team consisting of one interaction designer and one visual designer. Together we created the product experience in just two weeks.
We strived for a crisp look and feel, simple interaction patterns, and striking but minimalistic branding.
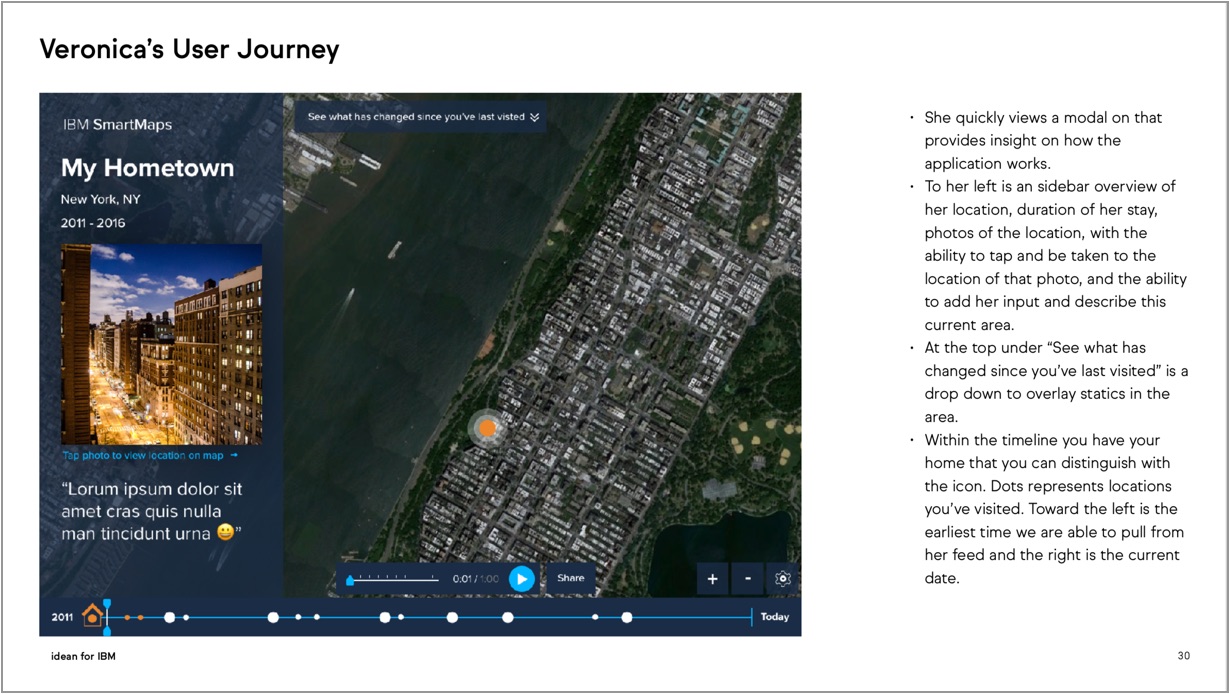
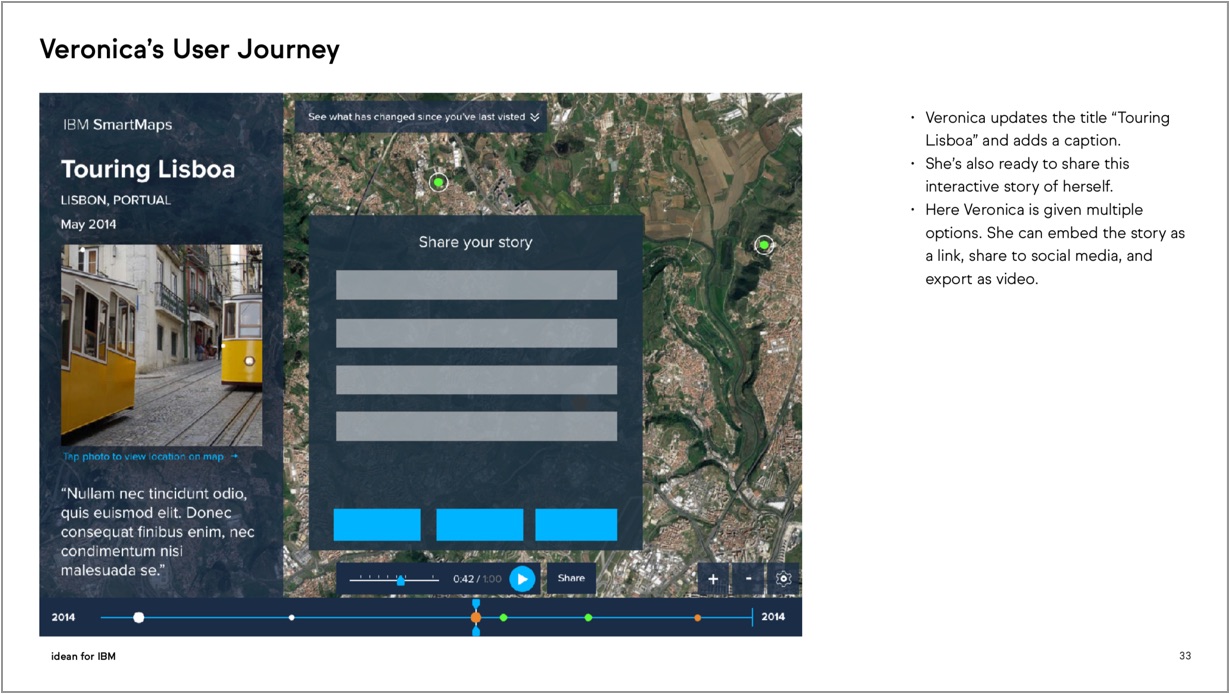
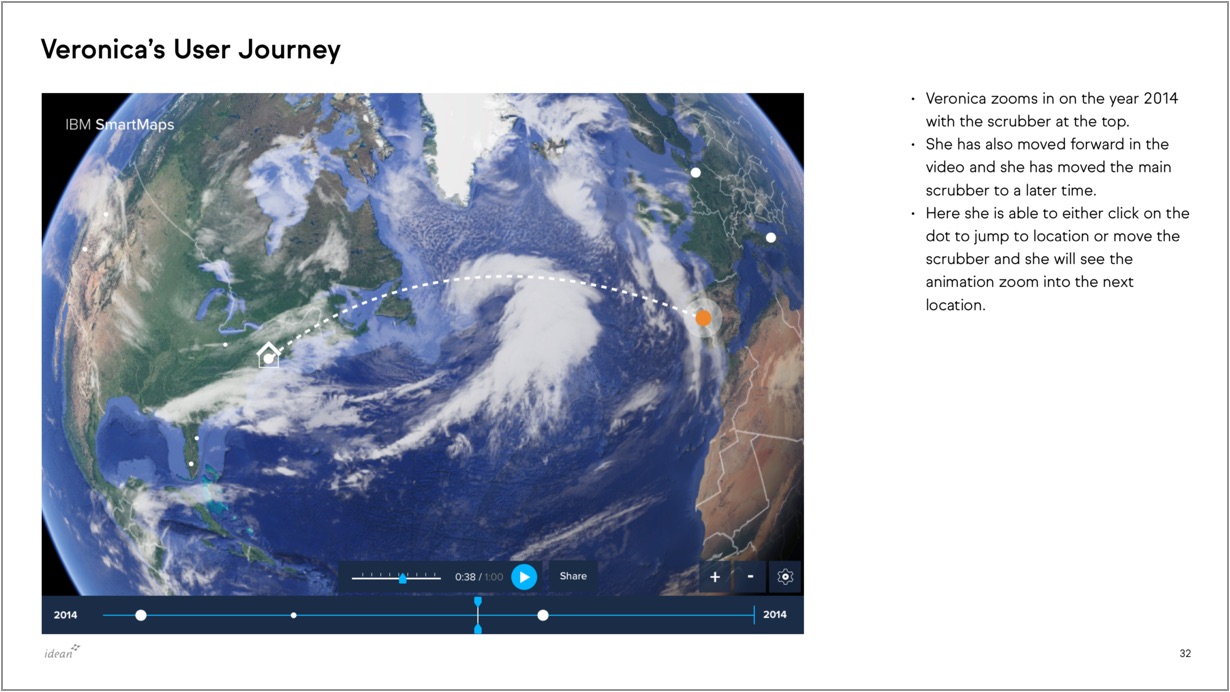
Starting with a fullscreen inviting landing page, the used would be welcomed to create and explore big-data in maps
The flow is navigated by stacking a number of specifications, starting from time and place...
You would intersect databases with boolean operations, as easy as you can change layer blending mode in photoshop.
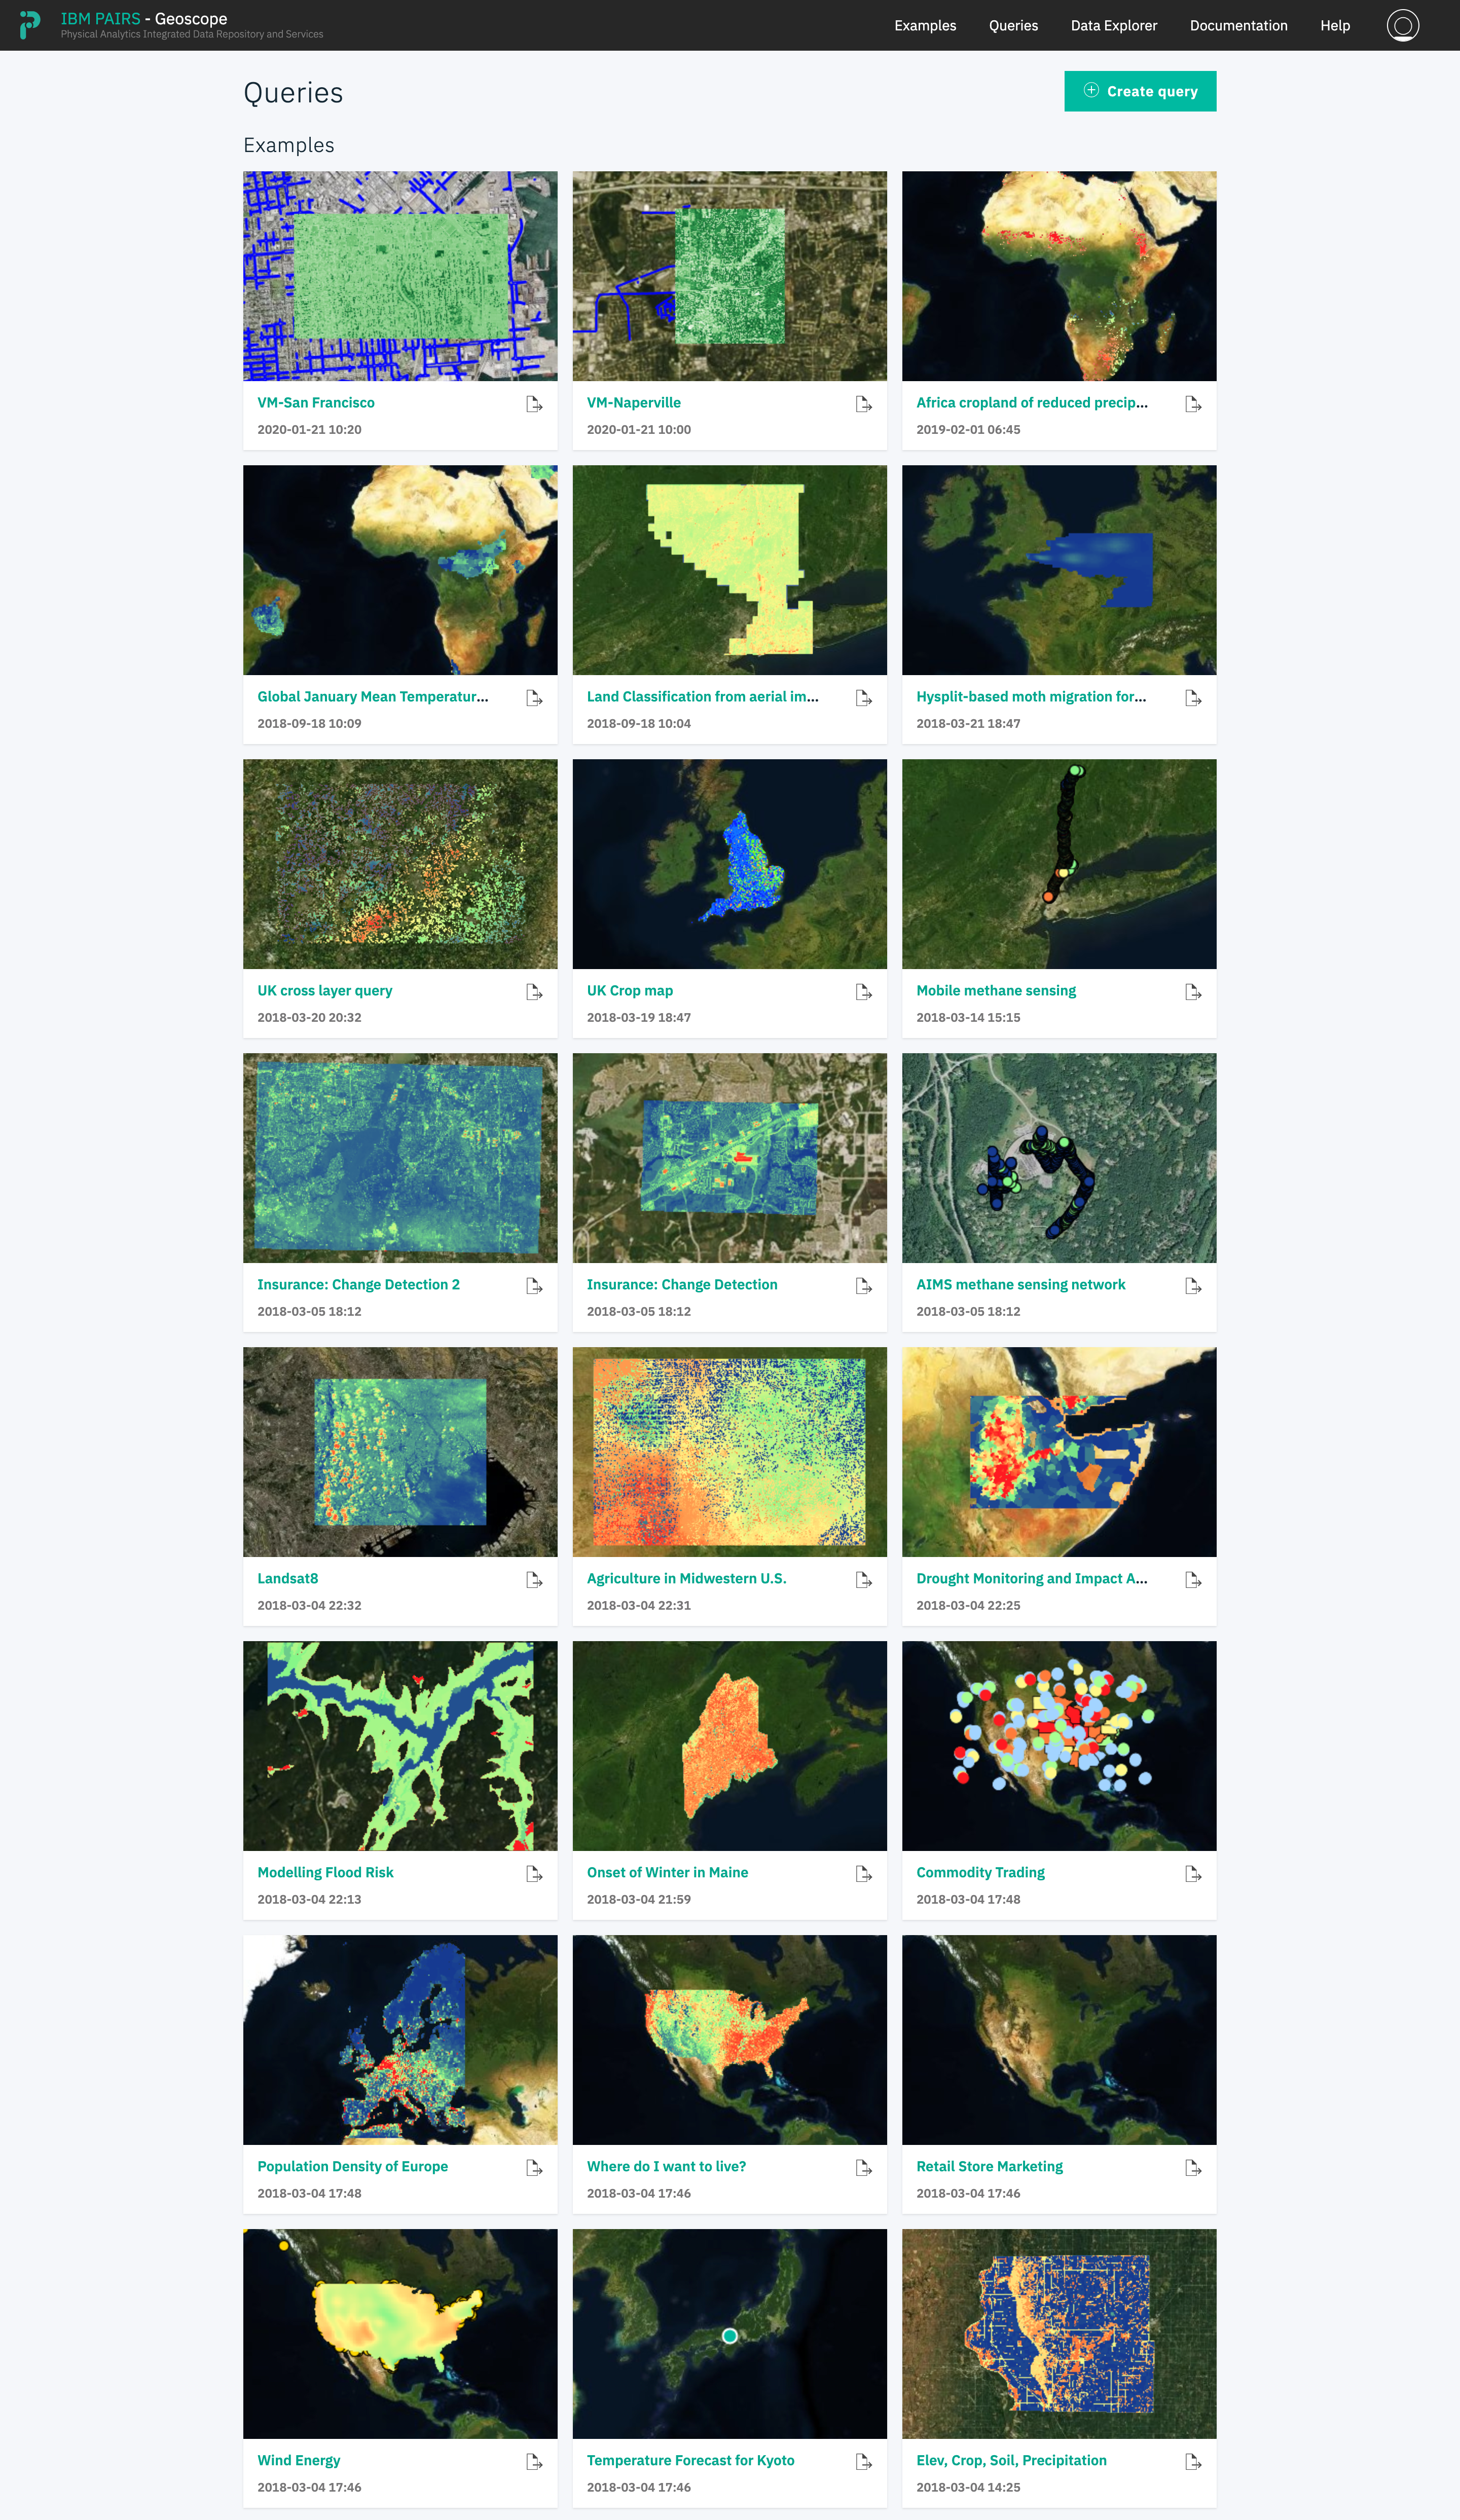
You would be able to start from pre-existing maps and tours, or you could create your own custom visualizations from scratch.
To specific objects of interest, from animal migration, to weather patterns.
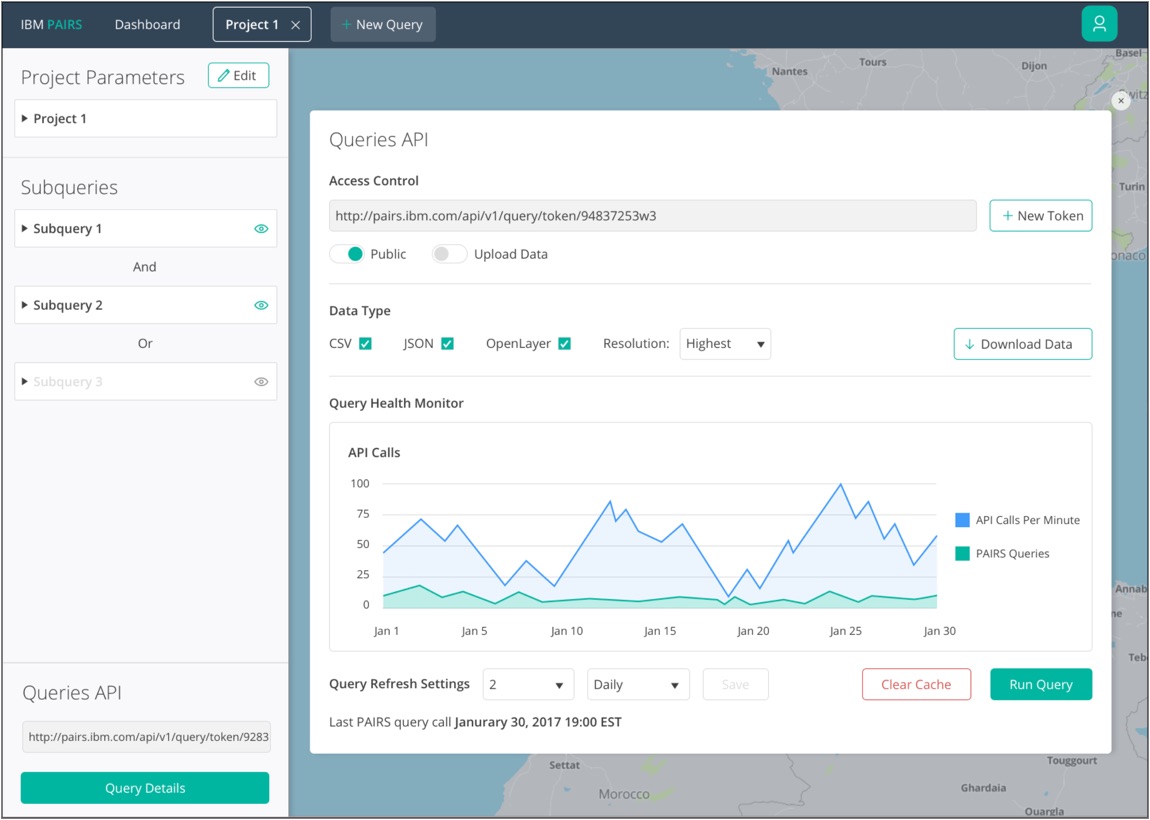
The user can monitor and customize the map via an open access API that constantly monitors the evolution of the query without having to constantly ping the main database.
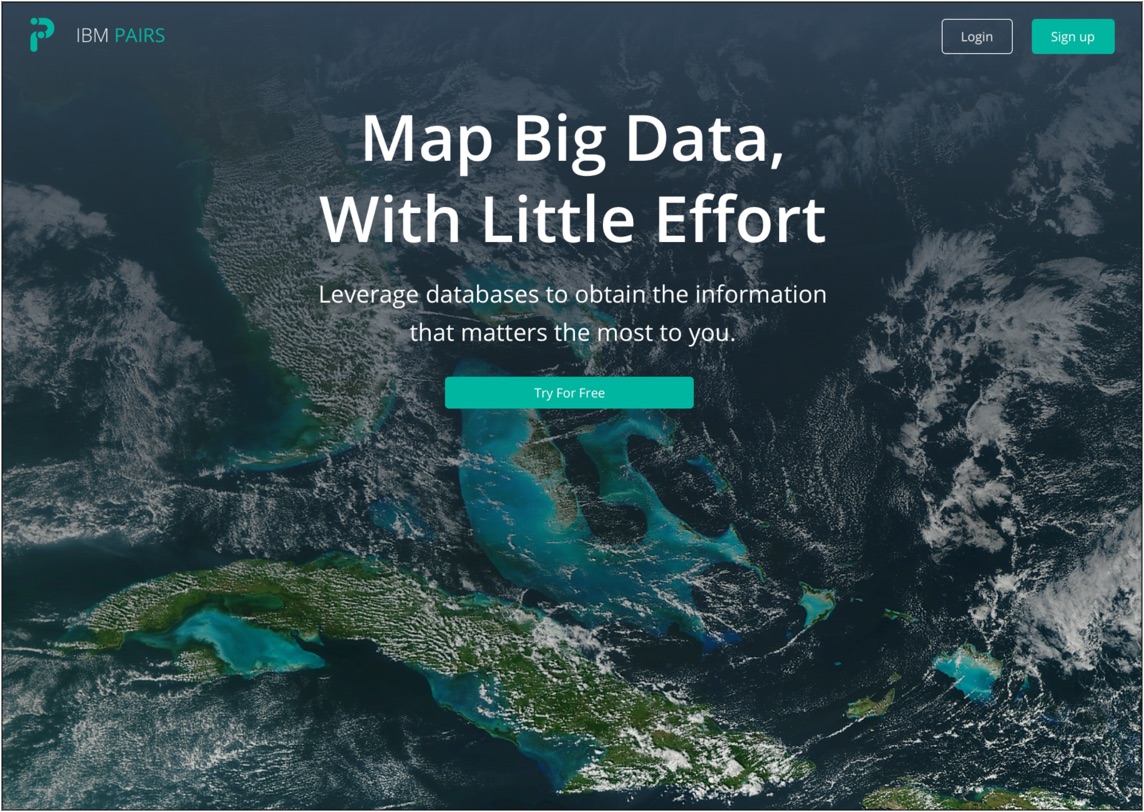
The Product we Launched
Once built, PAIRS Geoscope exited IBM Research, and became an integrated part of the IBM Cloud Services Marketplace, where it became accessible to anyone for demo purposes, and a SaaS for commercial clients. It's a real success story that made the career for several of our stakeholders, and became a case study for our agency.
- Highlighting a tornado trail by comparing before and after data
- Dataset browsing and selection
Live Product Screenshots
Different visualizations achieved through cross-dataset operations.
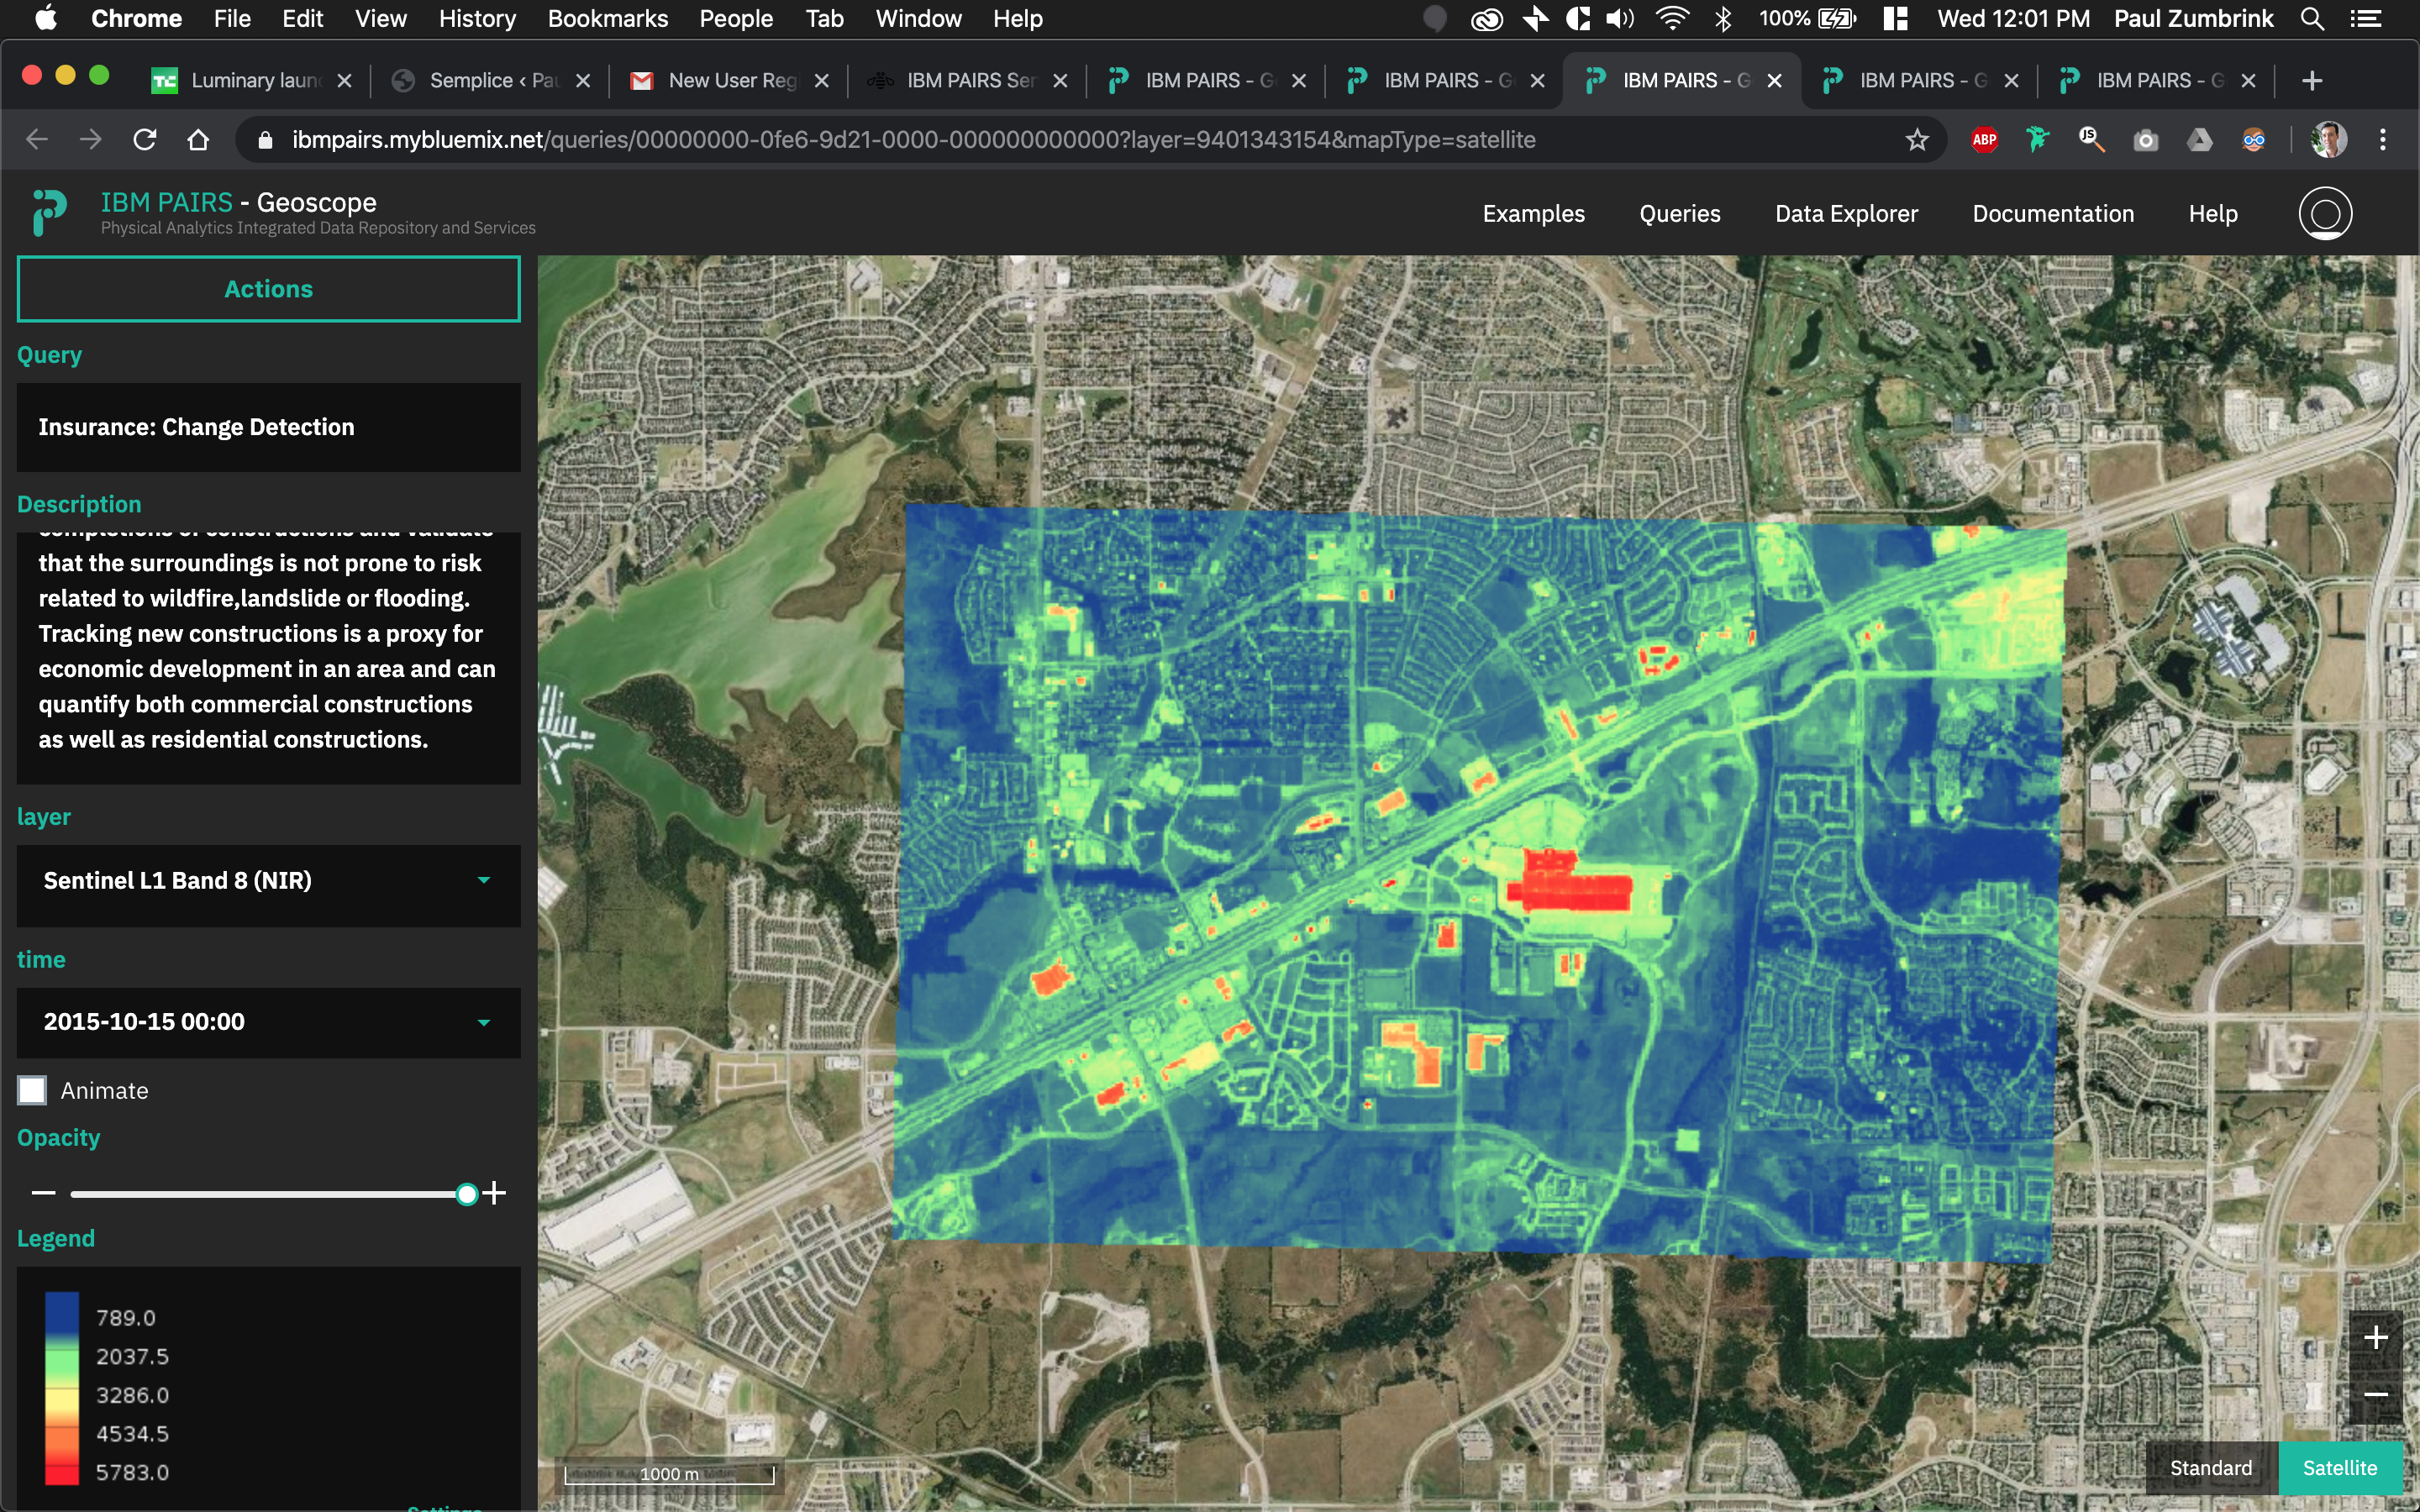
Detecting structural/architectural change by comparing different historical elevation maps.
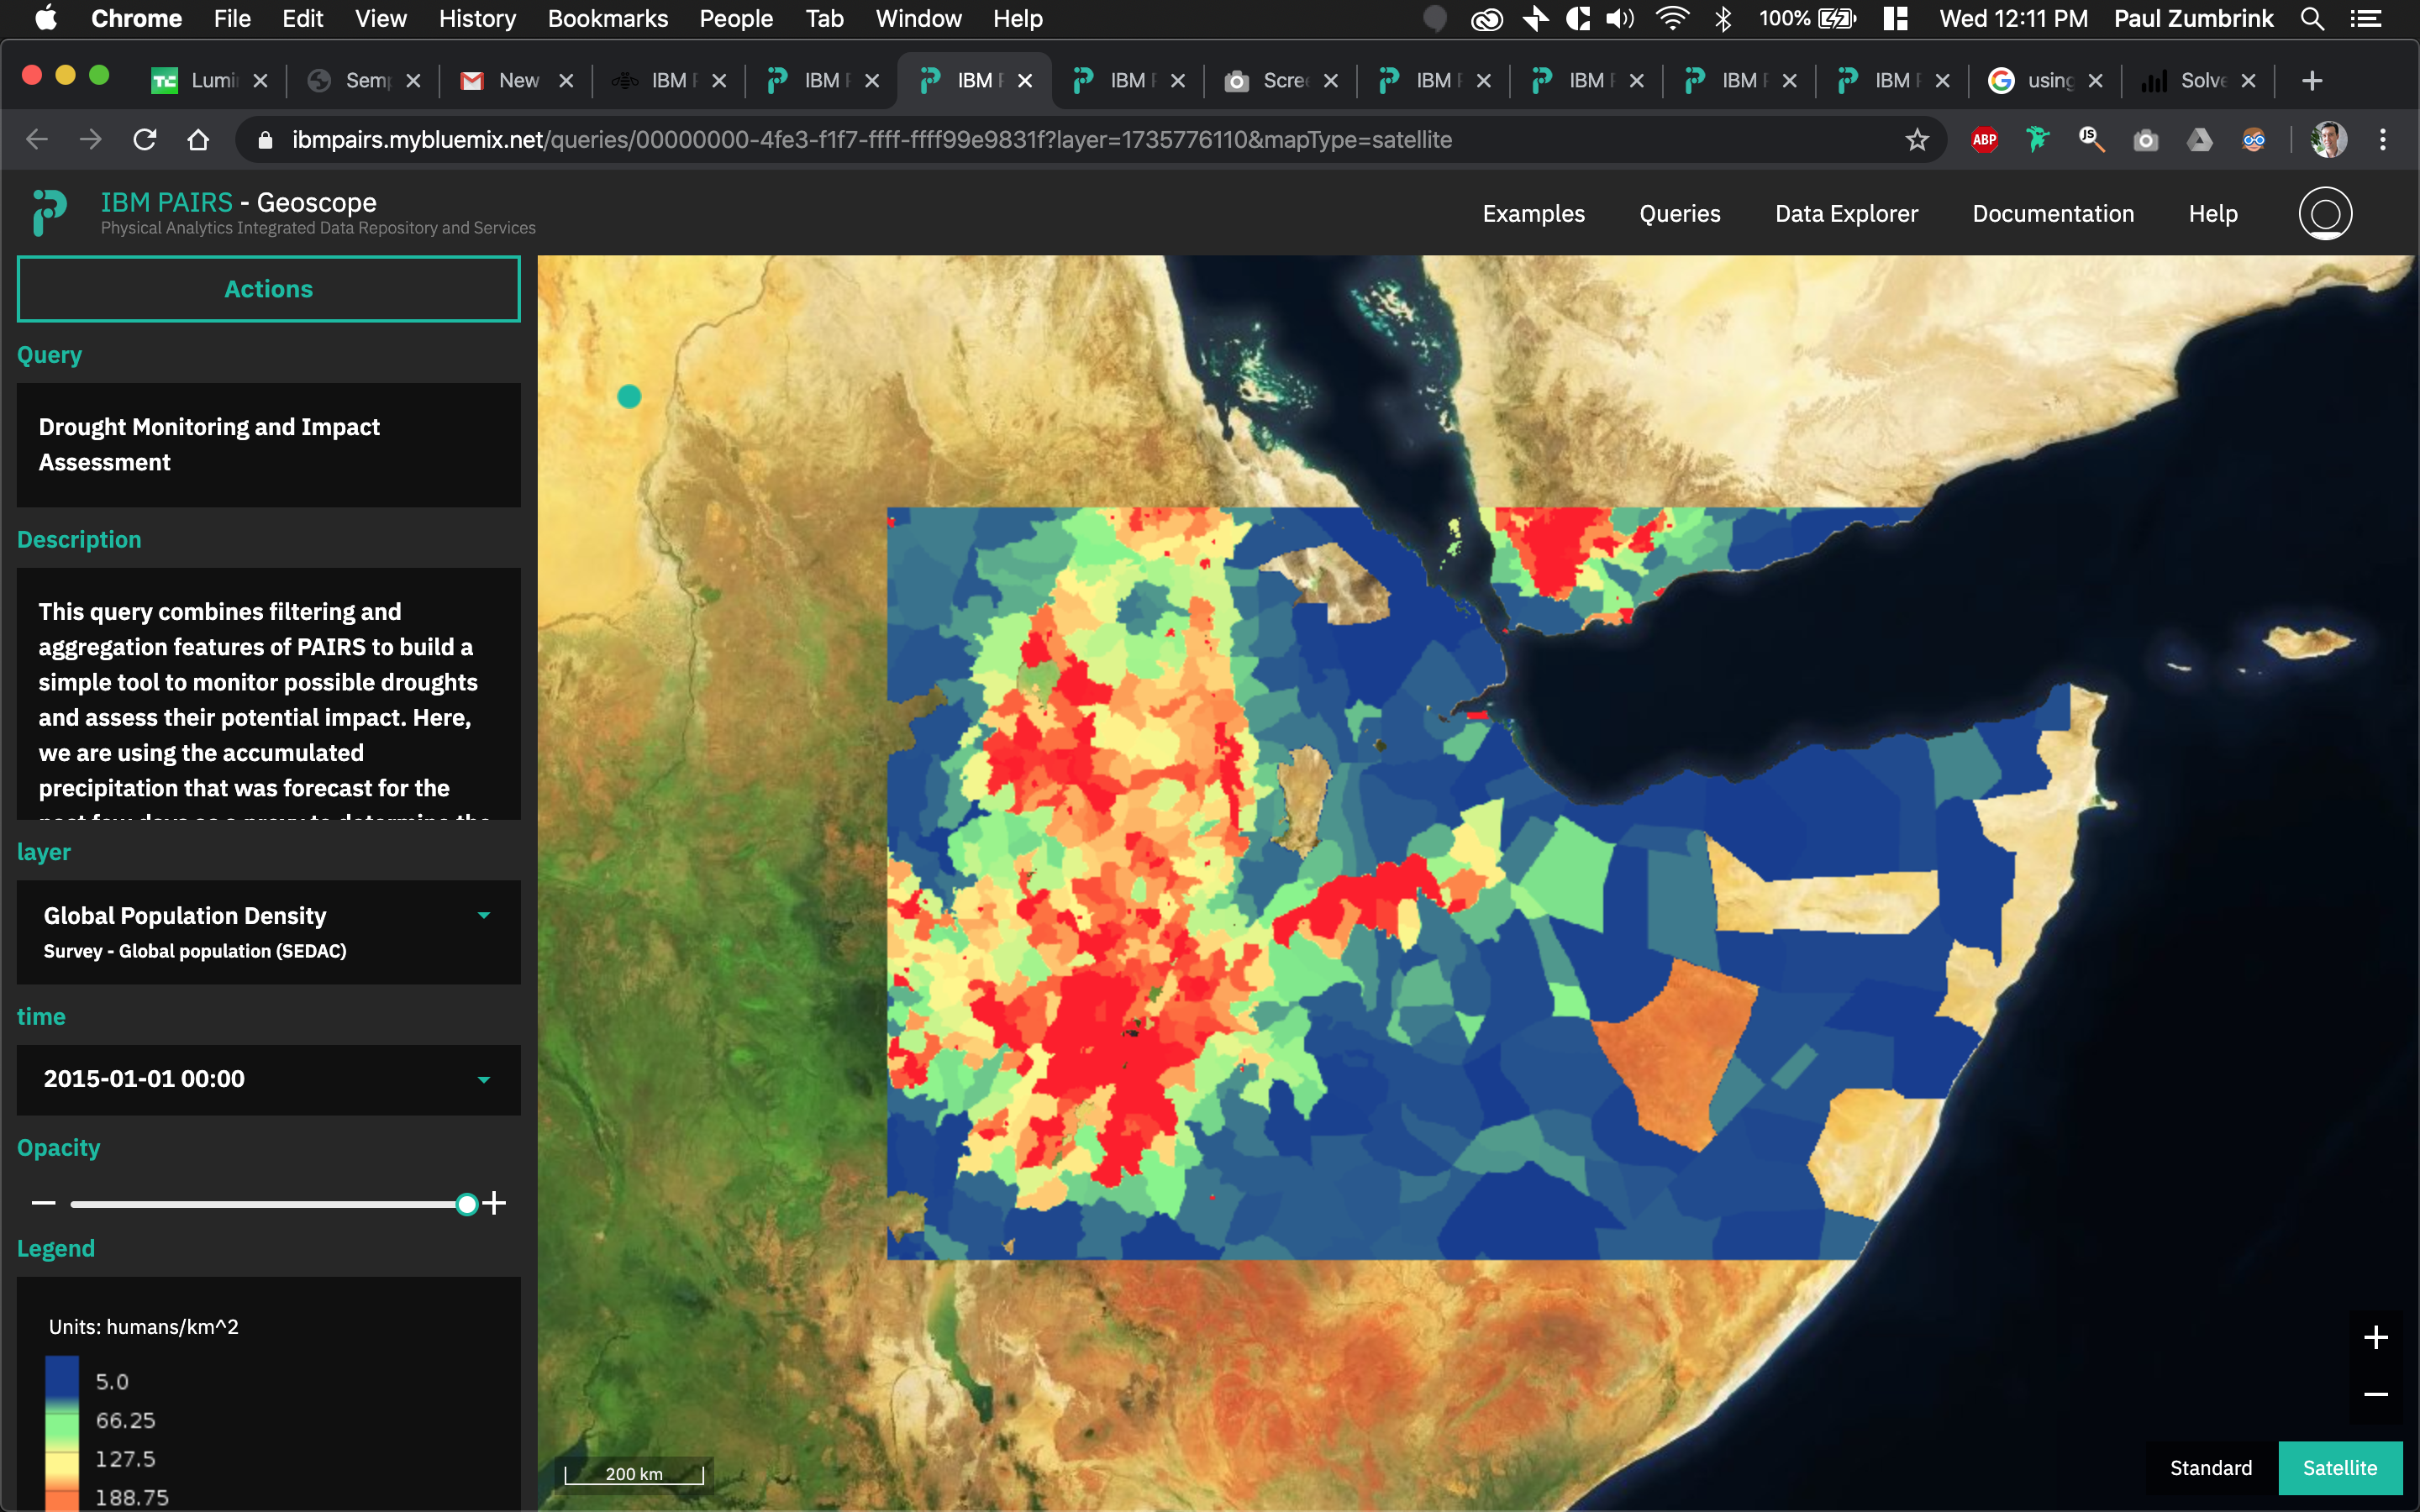
Monitoring "drought risk" areas, intersecting:
- Precipitation forecasts
- Average temperatures
- Population density
Media Darling
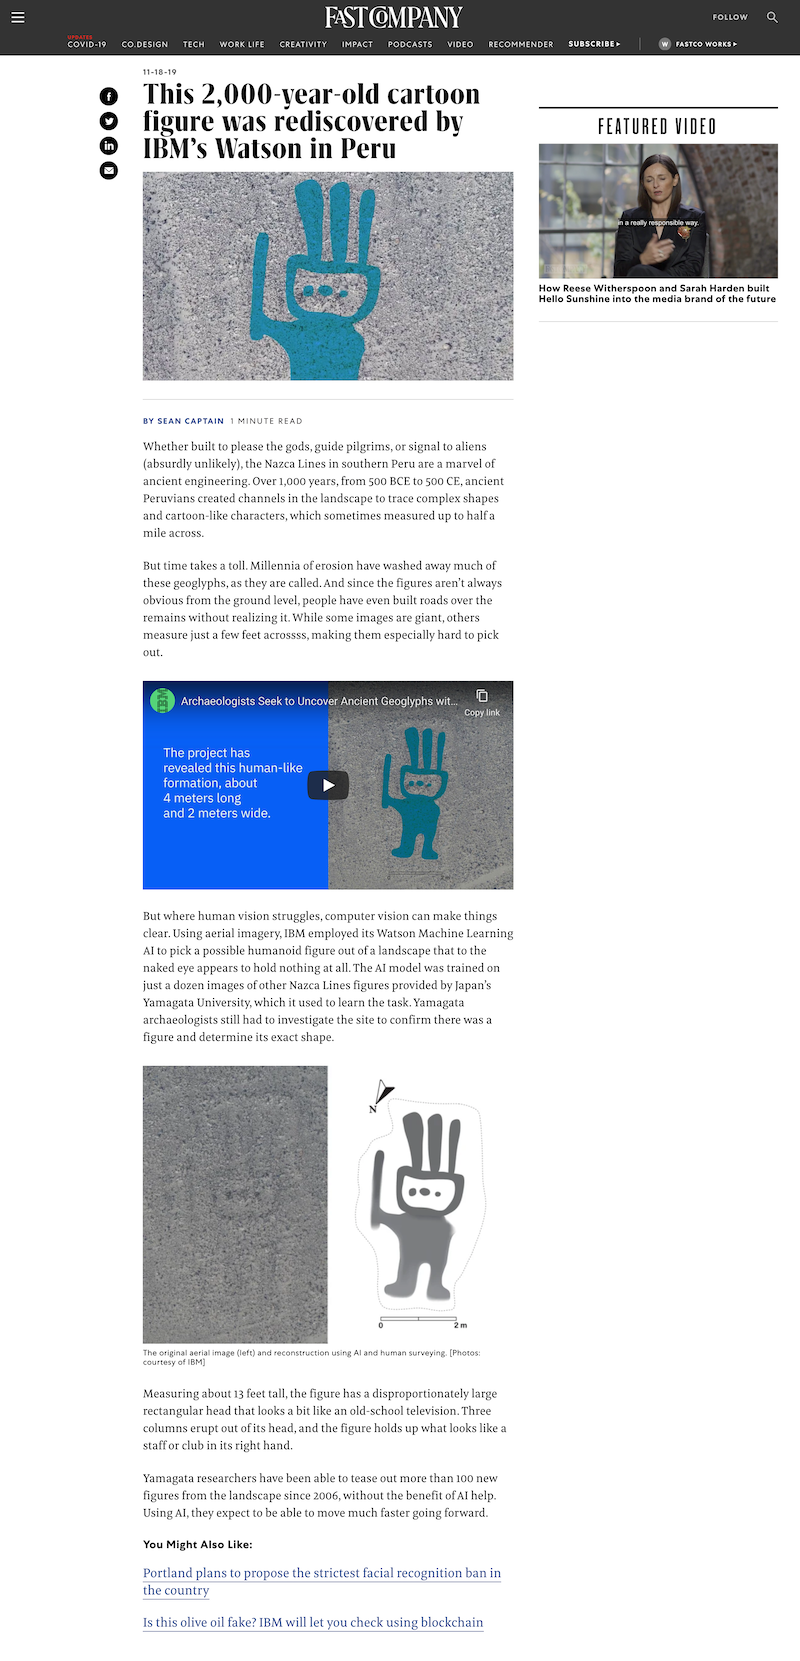
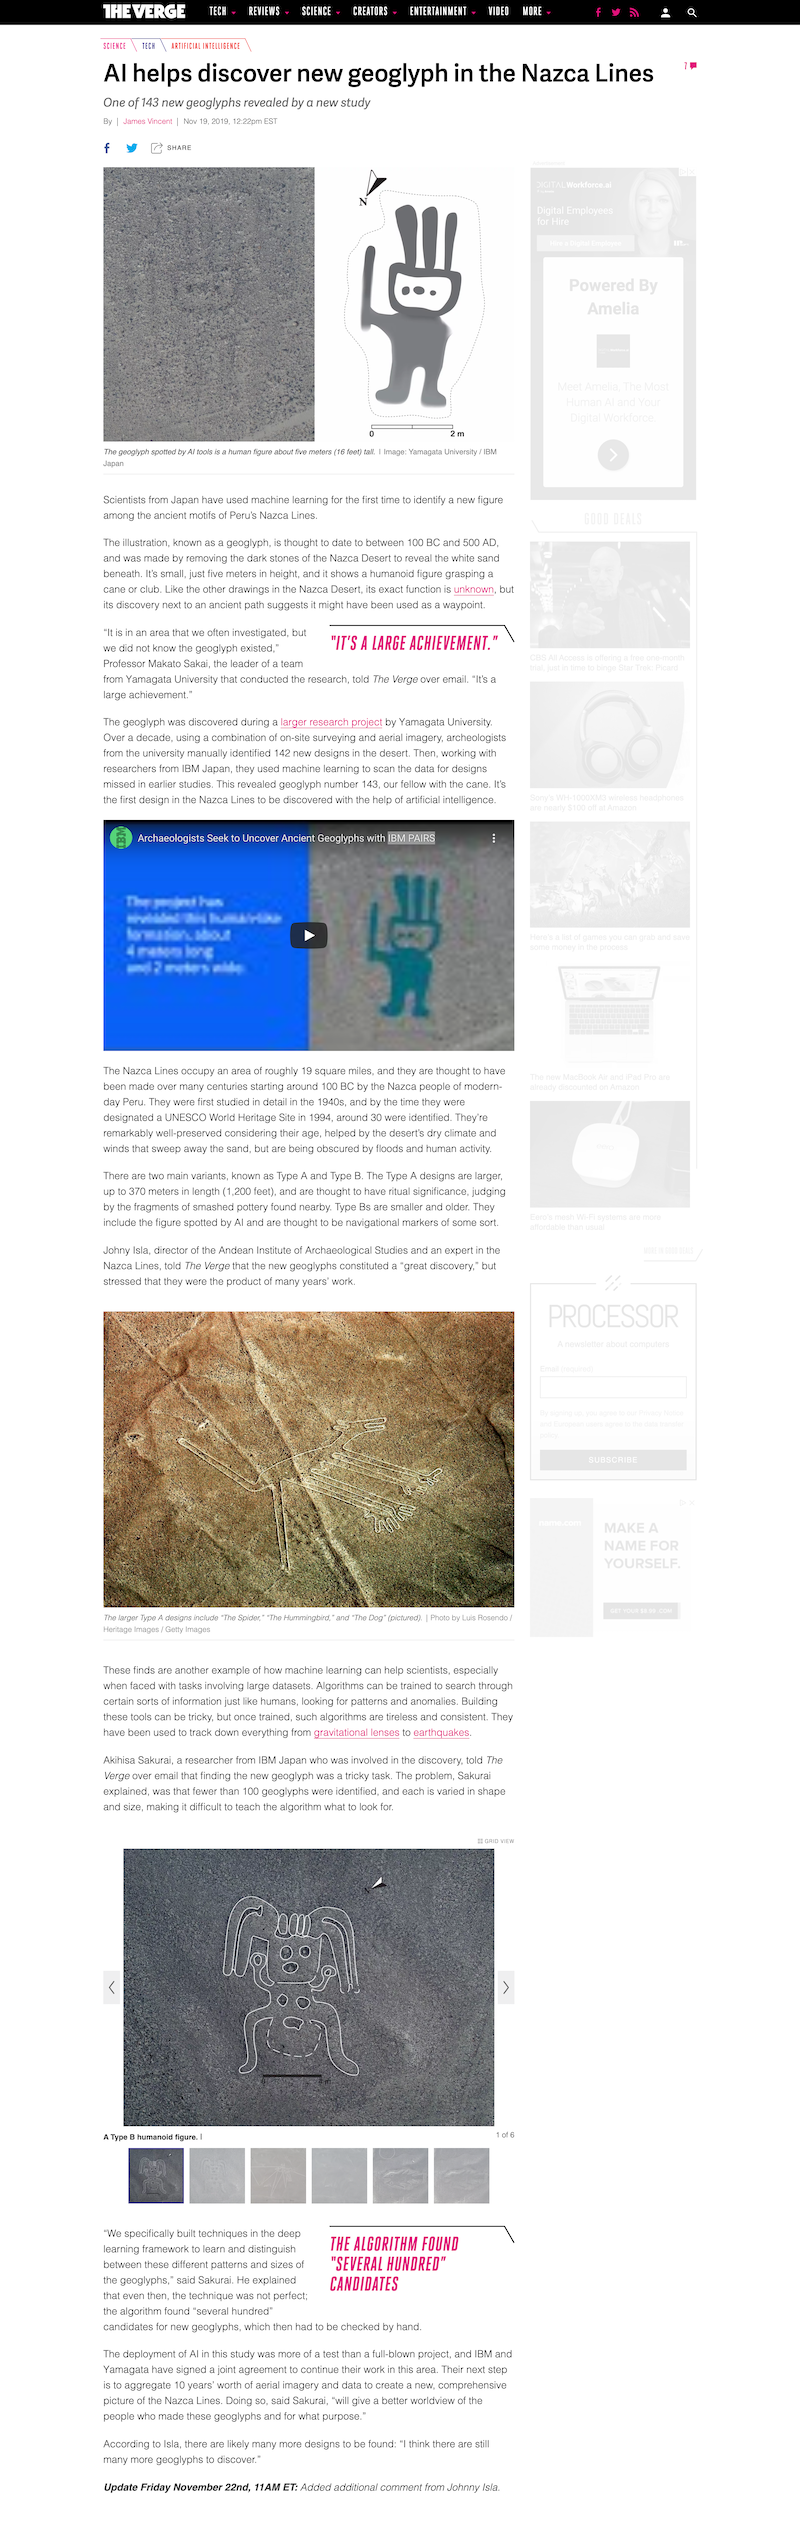
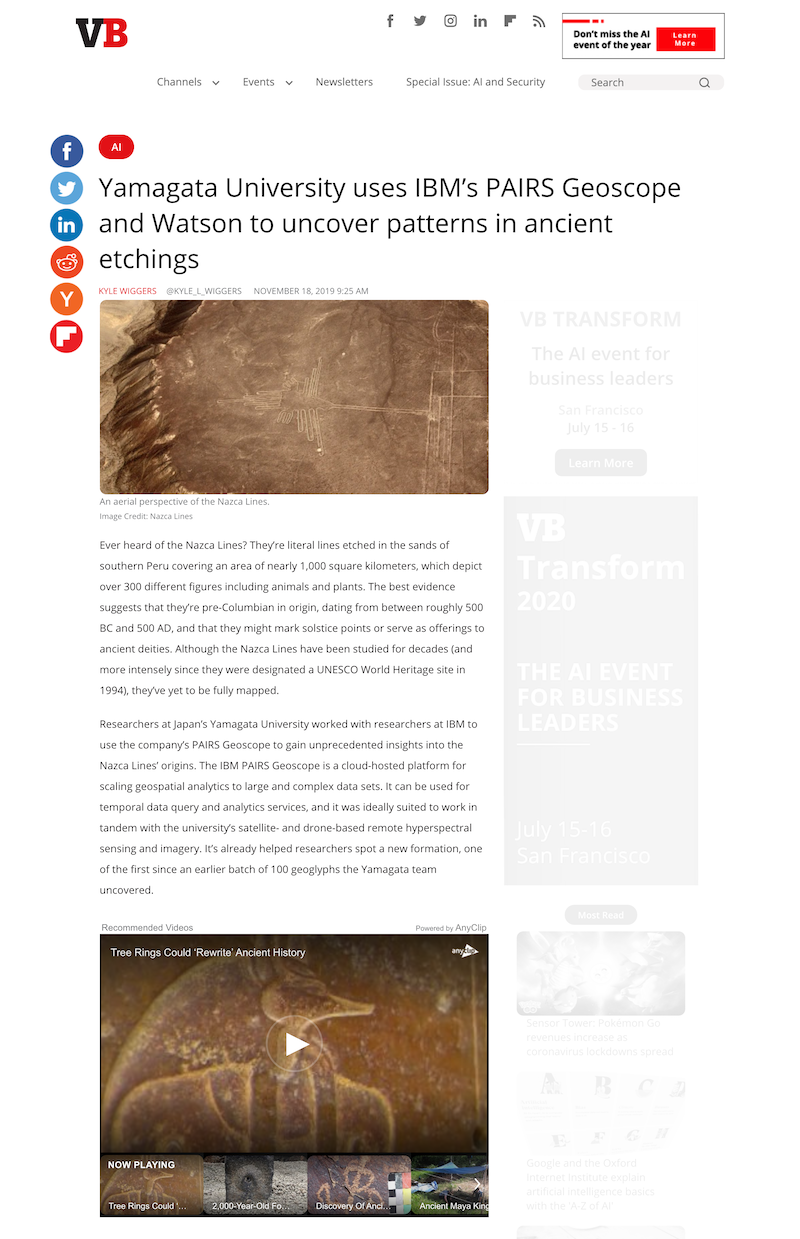
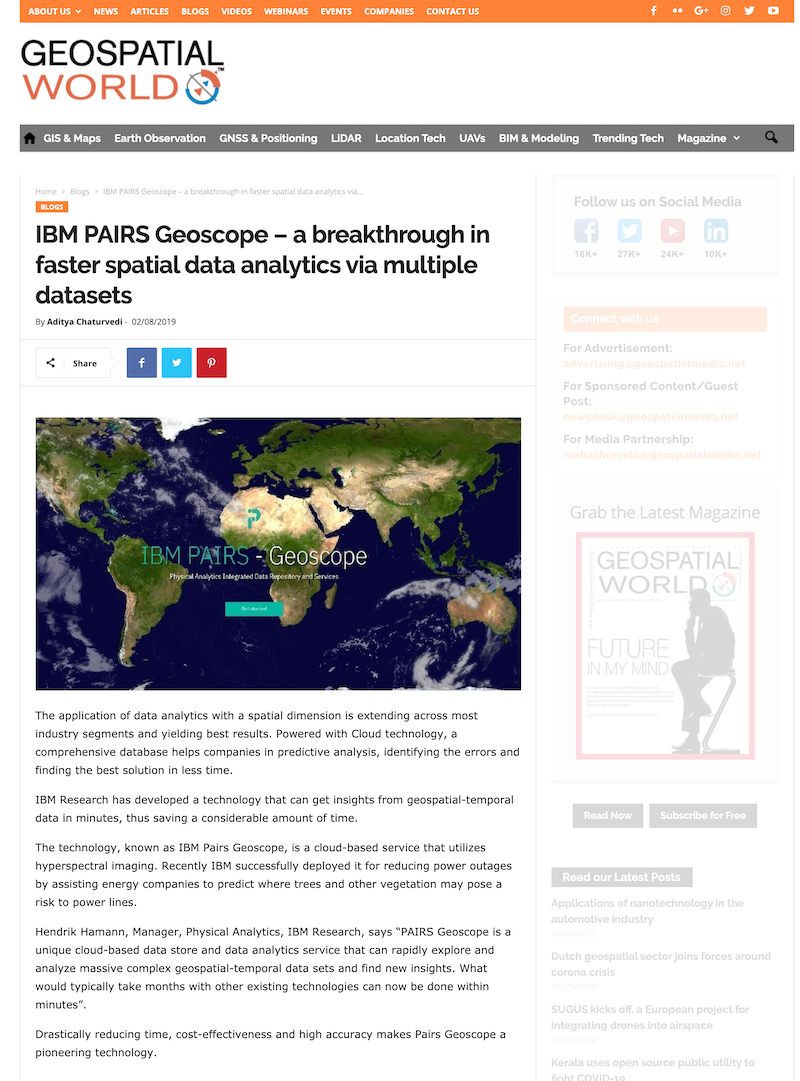
PAIRS went on to receive a flurry of attention from the press, not just because of the groundbreaking software, but because it enabled students from the Yamagata University to discover new architectural features at the Nazca Lines in Perú. Here's a few snapshots
Fast Company
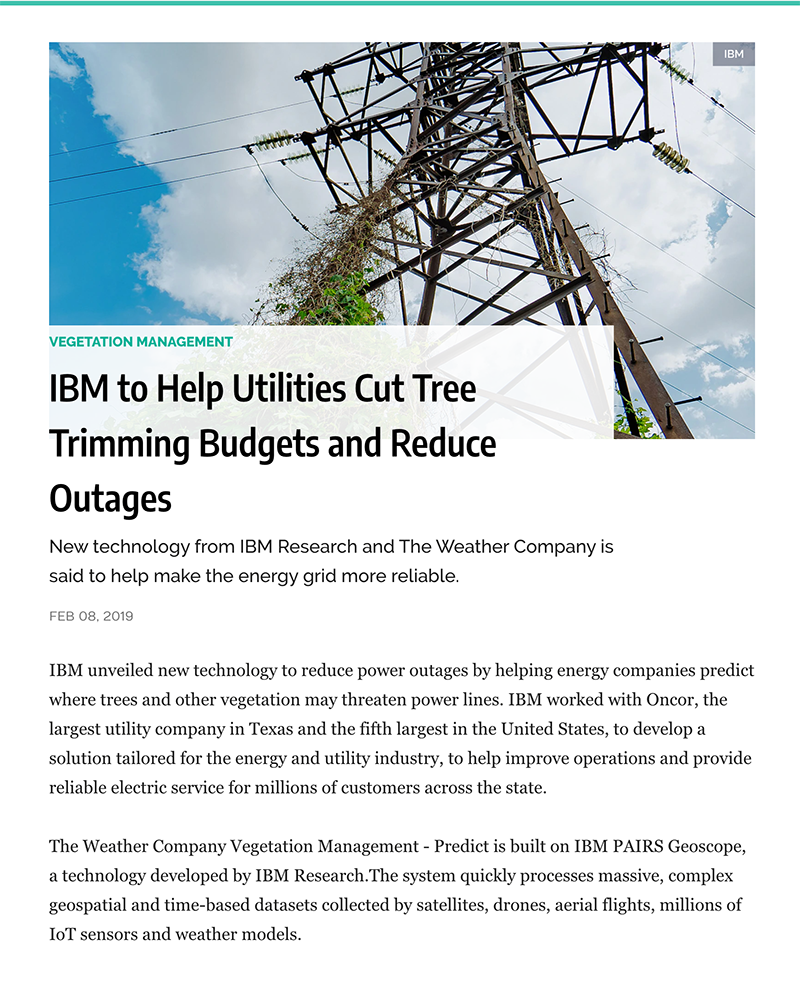
T&D World
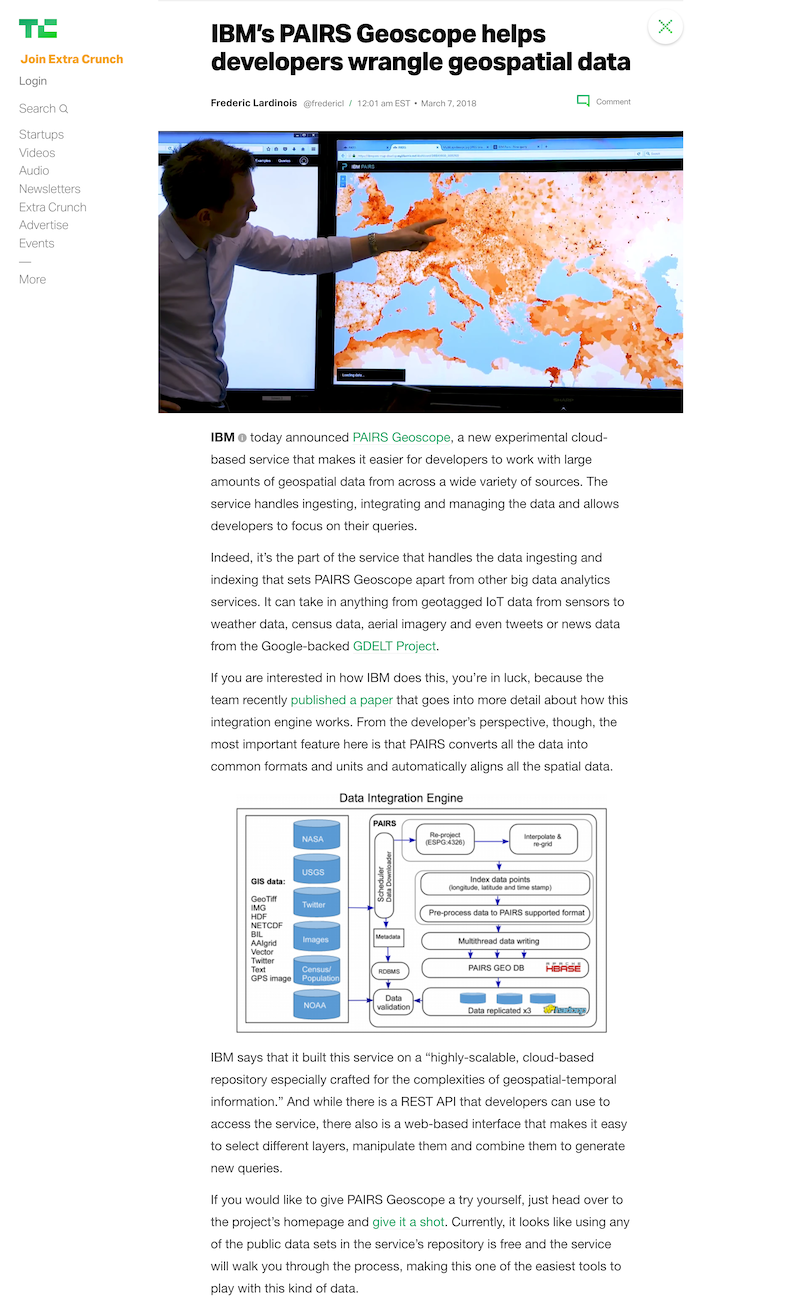
Tech Crunch
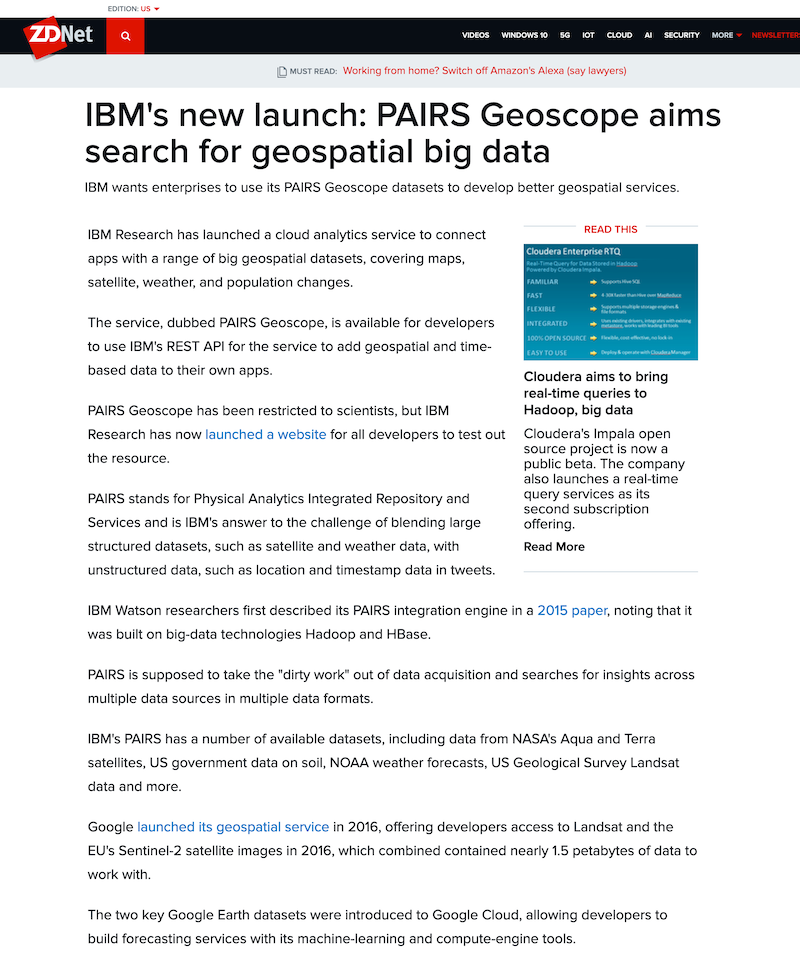
ZD Net
The Verge
Venture Beat
Geospatial World (Specialized media)
A Few Learnings
- Workshops are hard. It's 80% planning, and 20% improv and execution. Use it wisely.
- Remember, deliverables are mainly a tool to socialize and align with stakeholders
- Don't get too attached to an idea, defend your pov, but always stay open minded
- A great team is the basis for a great product
Our Team (@Idean)
- Skye McCloud, PM (Remote from Austin)
- Paul Zumbrink, UX Lead
- Ryder Carroll, Creative Director
- Johan García, Visual Designer
To comply with my non-disclosure agreement, I have omitted and obfuscated confidential information in this case study.
All information in this case study is my own and does not necessarily reflect the views of Idean or IBM.
© 2020 Paul Zumbrink. All rights reserved